111222

Use Business Certifications to Stand Out as a Seller

Quick Summary: Business certifications help sellers differentiate themselves by demonstrating verified expertise, building customer trust, and signaling commitment to quality. Key certifications include ISO 9001 for quality management, BBB Accreditation for business ethics, and industry-specific credentials like Certified Professional Sales Person (CPSP) that validate specialized knowledge and professionalism.

The marketplace is more crowded than it’s ever been. Sellers face constant pressure to prove they’re different, better, trustworthy. One effective way to cut through the noise? Business certifications.

These credentials aren’t just fancy letters after your name. They’re signals. Signals that you’ve met rigorous standards, invested in your professional development, and committed to operating at a higher level than the competition.

According to the U.S. Small Business Administration, your business structure and operational choices affect everything from taxes to personal liability. But here’s what many sellers miss: certifications influence customer perception just as profoundly. They provide third-party validation that marketing claims alone can’t deliver.

ISO, the International Organization for Standardization, frames it perfectly: International Standards mean consumers can have confidence that products and services are safe, reliable, and of good quality. That confidence translates directly into competitive advantage.

Why Business Certifications Actually Matter for Sellers

Real talk: certifications aren’t magic bullets. But they do solve specific, measurable problems that sellers face daily.

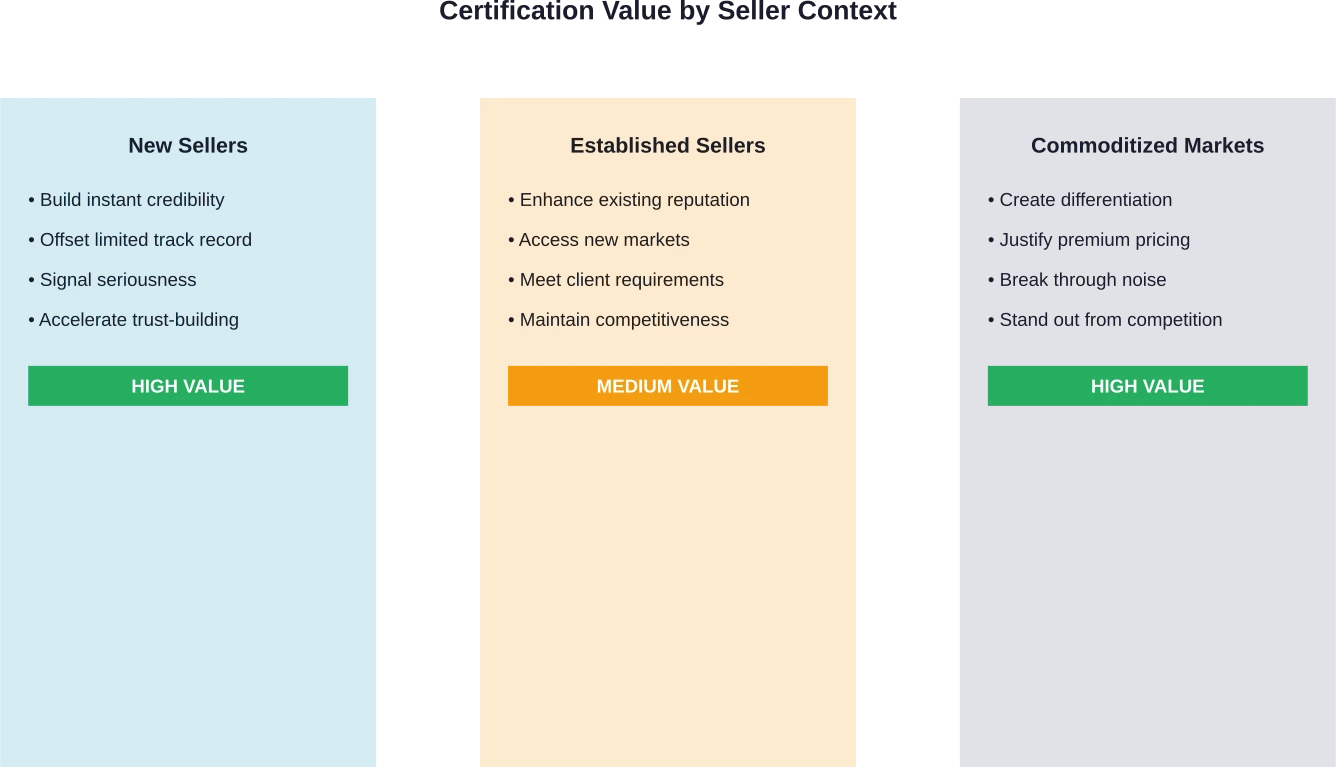
First, they build instant credibility. When potential customers see recognized certifications, they make assumptions about your competence, reliability, and professionalism. Fair or not, those assumptions shape buying decisions.

Second, certifications create differentiation in commoditized markets. When products or services appear similar, credentials become tiebreakers. The seller with verified expertise wins.

Third, many certifications come with ongoing requirements that actually improve operations. ISO 9001, for example, isn’t just about getting a certificate. It’s about implementing quality management systems that reduce errors, improve consistency, and enhance customer satisfaction.

Community discussions on platforms like Reddit frequently debate whether certifications matter in sales. The consensus? For established professionals with proven track records, certifications might be nice-to-haves. For newer sellers or those entering competitive markets, they’re closer to must-haves.

The Trust Factor

Trust is currency in selling. Certifications function as trust accelerators.

Better Business Bureau Accreditation Standards represent standards for business accreditation based on BBB’s determination of the attributes of a better business. These incorporate not only lawful business practices but also BBB’s experience with ethical advertising, selling, and customer experiences.

When buyers see BBB Accreditation or similar credentials, they shortcut the trust-building process. Instead of slowly establishing credibility through repeated positive interactions, certified sellers start with a baseline of assumed competence.

That matters enormously in high-stakes sales, considered purchases, or situations where buyers lack the expertise to evaluate quality independently.

Top Business Certifications That Help Sellers Stand Out

Not all certifications deliver equal value. Some are industry-standard requirements. Others are expensive distractions. Here’s what actually moves the needle for sellers in 2026.

ISO 9001: Quality Management Systems

ISO 9001 sets requirements for quality management systems. It’s one of the most recognized business certifications globally, applicable across industries and company sizes.

The ISO 9001:2015 SME success package specifically targets small and medium enterprises, offering practical guidance for implementation. The standard outlines requirements for a quality management system that organizations can use to demonstrate their ability to consistently provide products and services that meet customer and regulatory requirements.

For sellers, ISO 9001 certification signals process discipline, consistency, and commitment to continuous improvement. It’s particularly valuable in B2B contexts, government contracting, and industries where quality documentation is expected or required.

According to ISO, quality management is essential for healthy long-term success in our age of innovation and rapidly shifting expectations. That perspective resonates with buyers who want partners capable of sustaining performance over time.

BBB Accreditation

BBB Accreditation might seem old-fashioned, but it carries weight with consumers who research businesses before purchasing.

To qualify for BBB Accreditation, businesses must continually meet standards based on ethical advertising, selling, and customer experiences. Not all businesses qualify, which makes accreditation meaningful as a differentiator.

The accreditation appears in search results, social proof contexts, and decision-making moments. For sellers in retail, services, and consumer-facing industries, it’s a relatively accessible certification with immediate credibility benefits.

Certified Professional Sales Person (CPSP)

The National Association of Sales Professionals offers the Certified Professional Sales Person program, which uses modern behavior-based methodologies to transform learners into top-performing sales professionals.

At its core, the program focuses on accountability systems, coaching frameworks, and leadership development. Less than one percent of universities in the United States have a sales program, making specialized certifications like CPSP particularly valuable for career differentiation.

The Certified Professional Sales Person (CPSP) program is typically offered as a comprehensive 6-week online course with an all-inclusive enrollment fee (regularly $695). The program includes all modules, digital materials, and the certification exam within this single price. That investment signals commitment to professional standards that many competitors haven’t matched.

For sellers who want to distinguish themselves based on verified methodology rather than just experience, CPSP provides recognized validation.

Industry-Specific Certifications

Beyond general business certifications, industry-specific credentials often deliver the highest ROI for sellers operating in specialized markets.

E-commerce sellers might pursue certifications covering digital marketing, platform expertise, or international selling. With global online sales expected to hit $8.1 trillion by 2026 according to CertLibrary, e-commerce certification programs help professionals navigate complex digital selling environments.

Professional services providers benefit from credentials recognized within their specific fields. A financial advisor’s certifications differ dramatically from a marketing consultant’s, but both serve the same function: demonstrating verified expertise to potential clients.

The key is matching certification investment to market expectations. In some industries, certain certifications aren’t advantages—they’re table stakes.

Certification value varies by seller context, with highest impact for new sellers and those in commoditized markets

Choosing the Right Certifications for Your Selling Context

Here’s the thing though—piling up certifications doesn’t automatically translate to results. Strategic selection matters more than quantity.

Start by identifying what customers in your market actually value. Some credentials impress peers but leave buyers indifferent. Others directly address buyer concerns and accelerate purchasing decisions.

Research competitors. What certifications do leading sellers in your space hold? If most top performers have specific credentials, those might be prerequisites rather than differentiators.

Consider the investment required. Certification costs include not just fees but also time for study, implementation, and maintenance. The National Association of Sales Professionals’ CPSP program, for instance, involves module fees, exam costs, and annual renewal expenses that add up quickly.

Evaluate ongoing requirements. Some certifications are one-and-done. Others require continuing education, periodic audits, or regular renewals. ISO 9001 certification, for example, involves maintaining quality management systems that require sustained organizational commitment.

ROI Calculation Framework

Smart sellers treat certifications as investments requiring ROI analysis.

Estimate the customer lifetime value increase from improved conversion rates. If certification helps close 10% more deals or attracts slightly higher-value clients, calculate the annual revenue impact.

Factor in time savings. Certifications that streamline operations or reduce errors might pay for themselves through efficiency gains rather than direct sales impact.

Consider opportunity cost. Time spent pursuing certification A is time not spent on certification B, product development, or direct selling activities. Choose accordingly.

Certification Type Best For Investment Level Time to Value
ISO 9001 B2B sellers, manufacturers, services requiring process documentation High (implementation + certification) 6-12 months
BBB Accreditation Consumer-facing businesses, local services, retail Low to Medium Immediate
CPSP Sales professionals seeking methodology validation Medium ($500-700 initial) 3-6 months
Industry-Specific Specialized markets with recognized credentials Varies widely Varies by market recognition

Maximizing Certification Impact

Earning certifications is step one. Leveraging them effectively is where many sellers fall short.

Display credentials prominently. Add certification logos to websites, email signatures, proposals, and marketing materials. According to the U.S. Small Business Administration, how businesses present themselves affects customer perception and trust from first contact.

But don’t just slap logos everywhere. Explain what certifications mean in customer-relevant terms. Instead of “ISO 9001 Certified,” try “Independently verified quality systems ensuring consistent service delivery.”

Use certifications in sales conversations. When addressing objections about reliability, experience, or process rigor, reference relevant certifications as third-party validation.

Leverage certifications in content marketing. Blog posts, case studies, and thought leadership pieces that reference your certified expertise build authority while naturally incorporating trust signals.

Common Mistakes to Avoid

Pursuing irrelevant certifications wastes resources and confuses positioning. A B2B software seller probably doesn’t need retail-focused credentials, no matter how impressive they sound.

Letting certifications lapse signals inconsistency. If you promote a certification, maintain it. Expired credentials damage credibility more than never having them.

Overstating certification scope misleads customers and creates legal risks. Certifications apply to specific operations, locations, or product lines. Don’t claim broader coverage than actually exists.

Ignoring certification maintenance requirements creates compliance gaps. ISO certifications require ongoing audits. Professional credentials need continuing education. Budget for long-term commitment, not just initial achievement.

Effective certification strategy follows a structured implementation process with ongoing maintenance

Business Structure Considerations

According to the U.S. Small Business Administration, business structure affects everything from day-to-day operations to taxes and personal liability. It also influences which certifications make sense and how easily they’re obtained.

Sole proprietors face different certification pathways than corporations. Some credentials require specific organizational structures, liability coverage, or operational documentation that certain business types can’t easily provide.

Small business owners should consider certifications that accelerate professional development in multiple relevant areas. Getting certified in management, marketing, and operational areas broadens knowledge of best practices while gaining credentials that build customer trust.

The choice of business structure should happen before pursuing major certifications, since restructuring mid-process can complicate compliance and documentation requirements.

Standing Out on Amazon Also Means Managing Your Ads Well

Business certifications can help sellers stand out in Amazon’s marketplace, especially when buyers are comparing similar products. But visibility on Amazon still depends heavily on advertising performance and how campaigns are managed.

WisePPC helps sellers track and manage Amazon PPC campaigns with clearer data. The platform connects advertising and sales metrics in one dashboard so sellers can monitor performance, review historical campaign data, and adjust campaigns more efficiently.

If you want your certified products to reach more shoppers, WisePPC can help you:

  • track Amazon advertising performance across campaigns
  • analyze which keywords and ads drive sales
  • manage and update campaigns from a single interface

Certifications vs. Experience: Finding the Balance

Look, certifications don’t replace experience. They complement it.

A newly certified seller with no track record still faces credibility challenges. But an experienced seller without credentials might lose opportunities to less-experienced competitors who’ve invested in validation.

The sweet spot? Combining real-world results with recognized certifications that verify methodology and commitment.

Community discussions on platforms like Reddit frequently debate whether certifications matter in sales. The consensus leans toward context-dependency. In technical sales, specialized certifications carry weight. In relationship-driven industries, they matter less than proven results and references.

For sales professionals specifically, certifications like CPSP provide frameworks that systematize what top performers do instinctively. That benefits both the individual seller and the teams they eventually lead or train.

Industry-Specific Certification Opportunities

Every industry has its own certification ecosystem. Understanding which credentials carry weight in your specific market is crucial.

E-Commerce and Digital Selling

E-commerce certifications cover platform-specific expertise, digital marketing, international selling, and customer engagement strategies. With global online sales expected to hit $8.1 trillion by 2026 according to CertLibrary, e-commerce certification programs help professionals navigate complex digital selling environments.

Platform certifications from Shopify, Amazon, or eBay demonstrate technical proficiency. Marketing certifications from Google or Facebook validate advertising expertise. Combined, they position sellers as knowledgeable partners rather than just vendors.

Professional Services

Consultants, advisors, and service providers benefit enormously from industry-recognized certifications. These credentials often function as minimum qualifications rather than differentiators—clients expect them.

Financial services, healthcare, legal, and technical consulting all have established certification bodies whose credentials carry immediate recognition and weight with prospective clients.

Manufacturing and B2B Sales

ISO certifications dominate manufacturing and B2B contexts. ISO 9001 quality management certification is frequently required by large buyers, government agencies, and international customers.

Other relevant certifications include industry-specific safety standards, environmental management systems, and technical proficiency credentials tied to specific technologies or processes.

Industry Key Certifications Primary Benefit
E-Commerce Platform-specific, digital marketing Technical credibility, marketing expertise
Professional Services Industry associations, specialization credentials Minimum qualification, expertise validation
Manufacturing ISO 9001, safety standards Quality assurance, compliance
Retail BBB Accreditation, customer service certifications Consumer trust, ethical business practices
Technology Sales Vendor certifications, technical credentials Product expertise, solution capabilities

Measuring Certification Impact

How do sellers know if certifications are working? Track specific metrics before and after implementation.

Monitor conversion rates. Do more prospects convert after seeing certifications in proposals or presentations? Even small improvements in close rates can justify certification investments.

Track average deal size. Certifications that position sellers as premium providers might not increase volume but could attract higher-value clients willing to pay for verified expertise.

Measure sales cycle length. If certifications address common objections or speed trust-building, deals might close faster even if conversion rates stay constant.

Survey customers. Direct feedback reveals whether certifications influenced purchasing decisions. Many buyers won’t volunteer this information, but they’ll share it when asked.

Compare win rates against certified versus non-certified competitors. If your certification status correlates with competitive wins, that’s strong ROI validation.

Moving Forward with Certification Strategy

Business certifications aren’t magic credentials that automatically generate sales. They’re tools—effective when used strategically, wasteful when pursued randomly.

The sellers who benefit most are those who match certifications to genuine market needs, implement them thoroughly, and leverage them consistently in sales and marketing contexts.

Start by assessing what customers in your market actually value. Research competitor certifications. Calculate potential ROI based on realistic conversion improvements or deal size increases.

Choose one or two high-impact certifications rather than collecting credentials indiscriminately. Implement them properly. Promote them intelligently. Measure results.

According to ISO, successful businesses share one essential ingredient: quality. Certifications provide verifiable proof of quality commitment that marketing claims alone can’t deliver.

In competitive markets where buyers struggle to differentiate between similar offerings, that proof makes the difference between being selected and being passed over.

The question isn’t whether certifications matter. It’s whether you’re using the right ones, in the right way, to stand out where it counts.

Ready to differentiate your business through strategic certification? Start by identifying which credentials your ideal customers recognize and value, then build a implementation roadmap that balances investment against expected returns. The sellers who win in 2026 won’t just have credentials—they’ll have the right credentials, properly leveraged.

Frequently Asked Questions

Are business certifications worth the investment for small sellers?

For small sellers, certifications offer disproportionate value by offsetting limited track records and competing against larger, established competitors. BBB Accreditation and industry-specific certifications typically provide the highest ROI for small businesses, as they’re relatively affordable while delivering immediate credibility benefits. The key is choosing certifications that customers in your specific market recognize and value.

How long does it take to earn major business certifications?

Timeline varies significantly by certification type. BBB Accreditation can be obtained relatively quickly once business meets requirements. ISO 9001 typically requires 6-12 months for implementation and certification. Professional sales certifications like CPSP take 3-6 months depending on study pace. Complex industry-specific certifications might require a year or more of preparation, training, and assessment.

Do certifications actually help close more sales?

Certifications influence sales outcomes indirectly by building trust, reducing buyer risk perception, and differentiating sellers in competitive situations. They work best as tiebreakers when buyers compare similar options, or as trust accelerators with new customers who lack references or experience with the seller. Certifications alone don’t close deals, but they remove obstacles and objections that might otherwise prevent closes.

Which certification should I pursue first?

Start with certifications that address your biggest credibility gaps or market requirements. New sellers benefit most from broad credibility builders like BBB Accreditation. Sellers in quality-sensitive industries should prioritize ISO 9001. Those in specialized fields should pursue industry-standard credentials that customers expect. Research what leading competitors hold and what customers mention during sales conversations.

How do I promote certifications without seeming arrogant?

Frame certifications as customer benefits rather than seller achievements. Instead of “We’re ISO 9001 certified,” try “Our independently verified quality systems ensure consistent delivery.” Use certification logos in marketing materials and website footers as visual signals without heavy-handed promotion. Reference certifications when directly relevant to addressing customer concerns about quality, reliability, or expertise.

Can certifications replace a proven track record?

No. Certifications validate methodology and commitment but don’t substitute for demonstrated results. They work best combined with case studies, testimonials, and verifiable outcomes. For new sellers, certifications help compensate for limited track records by providing third-party validation of capabilities. For established sellers, certifications enhance rather than replace reputation.

What’s the difference between certifications and accreditations?

Certifications typically validate individual or organizational competence in specific skills or knowledge areas. Accreditations verify that organizations meet broader operational, ethical, or quality standards established by recognized bodies. BBB Accreditation, for example, assesses overall business practices, while sales certifications verify specific professional capabilities. Both provide third-party validation but at different scopes.

Amazon’s New FBA Capacity Management: 4 Key Features

Quick Summary: Amazon announced a streamlined FBA capacity management system in 2023 that replaced separate weekly restock and quarterly storage limits with a unified monthly capacity limit per storage type. The four key features include: single month-long FBA capacity limits, Capacity Manager for requesting additional storage, performance-based limit increases tied to IPI scores, and capacity reservation through competitive bidding.

Amazon sellers faced a frustrating puzzle for years: juggling weekly restock limits alongside quarterly storage caps, each measured differently, each creating inventory headaches. That changed when Amazon rolled out a streamlined FBA capacity management system.

The announcement came in January 2023, effective March 1 of that year. According to Amazon’s official Seller Central announcement from January 17, 2023, the changes addressed direct seller feedback about the difficulty of planning inventory procurement and manufacturing around conflicting limit types.

This wasn’t just a minor tweak. The new system fundamentally changed how sellers approach FBA storage, replacing confusion with clarity—though not without creating new challenges sellers need to understand.

What Changed: From Dual Limits to Unified Capacity

Before March 2023, sellers navigated two separate constraint systems. Weekly restock limits controlled how much inventory could be shipped to FBA each week. Quarterly storage limits capped total volume stored across three-month periods.

The problem? These limits measured inventory differently and operated on different timescales. A seller might have available quarterly storage but hit their weekly restock cap, blocking replenishment of fast-moving products. Or they’d have restock capacity but approach their quarterly limit, forcing difficult decisions about which products to prioritize.

Amazon’s solution consolidated everything into monthly capacity limits per storage type. Instead of tracking two moving targets, sellers now work with a single number that refreshes monthly.

Here’s what that means in practice. Sellers receive a capacity limit measured in cubic feet for each storage category (standard-size, oversize, apparel, footwear, flammable, and aerosol). This limit covers all inventory—what’s currently stored at FBA plus what’s in transit in open shipments.

The monthly refresh gives sellers predictable planning windows. At the start of each month, limits reset based on performance metrics and forecasted sales. Sellers can see their capacity allocation weeks in advance through the Capacity Monitor in Seller Central’s FBA Dashboard.

Feature #1: Single Month-Long FBA Capacity Limits

The cornerstone of the new system is the unified monthly limit. According to Amazon’s official announcement from January 2023, this addresses the primary pain point sellers reported: difficulty planning procurement and manufacturing around short weekly windows.

Each seller receives a capacity allocation per storage type, measured in cubic feet. This represents the maximum volume allowed across all inventory—currently stored units plus shipments in transit to fulfillment centers.

The calculation updates throughout the month as inventory moves. When products sell and ship out, that freed capacity becomes immediately available for new shipments. When shipments arrive and check in at fulfillment centers, they count against the limit.

Monthly limits provide longer planning horizons than weekly caps. Sellers manufacturing overseas can better coordinate production runs with shipping timelines. Those working with 3PLs gain flexibility in scheduling inbound shipments without rushing to hit weekly deadlines.

But there’s a catch many sellers discovered quickly. Amazon assigns these limits based on performance metrics, particularly the Inventory Performance Index (IPI). A seller with lower IPI scores might receive capacity that covers only 60-70 days of inventory at current sales velocity—not enough buffer for long lead times from overseas suppliers.

The monthly structure also means sellers face capacity constraints differently than before. Community discussions on Seller Central forums show sellers struggling when their limit drops below their current usage, blocking all new shipments until inventory sells down. This happens when IPI scores decline or Amazon adjusts capacity allocations based on fulfillment center space availability.

How Monthly Limits Are Calculated

Amazon determines monthly capacity using multiple factors. The IPI score carries significant weight—sellers maintaining scores above 500 typically receive higher limits than those below 400. Sales volume and forecasted demand also influence allocations, with higher-velocity sellers generally earning more capacity.

Storage duration matters too. Inventory sitting in FBA for extended periods signals poor turnover, potentially reducing future capacity allocations. Amazon wants fulfillment centers functioning as active distribution hubs, not long-term warehouses.

Seasonal patterns affect limits as well. Sellers often see increased capacity heading into Q4 to accommodate holiday inventory, then reductions in Q1 as demand normalizes.

The system accounts for inventory already in the network. If a seller has 500 cubic feet stored and 200 cubic feet in shipments checking in, their total usage is 700 cubic feet. With a 1,000 cubic foot limit, they have 300 cubic feet available for new shipments.

Feature #2: Capacity Manager for Additional Storage Requests

Amazon introduced the Capacity Manager as a solution for sellers who need more space than their base allocation provides. This tool, accessible through Seller Central, lets sellers request additional capacity beyond their standard monthly limit.

The request process involves competitive bidding. Sellers specify how much additional capacity they want and what reservation fee per cubic foot they’re willing to pay. Amazon then grants requests objectively, starting with the highest reservation fee offers until available capacity runs out.

According to the official announcement, when a request is granted, the reservation fee gets offset by performance credits. This creates an interesting dynamic—sellers essentially pay for guaranteed access, but strong performance can reduce or eliminate the net cost.

The Capacity Manager updates regularly, showing sellers their current limit, usage, and available capacity. Sellers can submit requests for upcoming months, allowing advance planning for promotional events or seasonal peaks.

Not all requests get approved. During high-demand periods, particularly Q4, competition for extra capacity intensifies. Sellers willing to pay higher reservation fees get priority, creating a market-based allocation system.

This feature sparked mixed reactions in seller communities. Some appreciate the option to buy additional space when needed. Others criticize it as Amazon essentially charging for something that was previously included in FBA fees, especially when base allocations feel artificially constrained.

Strategic Use of Capacity Manager

Smart sellers approach Capacity Manager strategically rather than reactively. Waiting until inventory runs low to request additional capacity can backfire—requests aren’t instant, and competitive periods may leave sellers outbid.

Successful strategies include requesting extra capacity well ahead of anticipated needs, particularly before major selling events like Prime Day or Black Friday. Sellers also analyze their reservation fee tolerance by calculating the cost per cubic foot against potential lost sales from stockouts.

For products with high margins and fast turnover, paying reservation fees often makes financial sense compared to missing sales. For lower-margin items with slower velocity, the economics work differently.

Some sellers use Capacity Manager as insurance, requesting modest additional capacity even when current limits seem adequate. This buffer protects against unexpected demand spikes or shipping delays that could otherwise trigger stockouts.

Feature #3: Performance-Based Limit Increases

The new capacity system ties limits directly to seller performance, with the Inventory Performance Index (IPI) score as the primary metric. This represents a fundamental shift—capacity becomes a reward for efficient inventory management rather than a static entitlement.

IPI scores range from 0 to 1,000, calculated based on four key factors: excess inventory percentage, in-stock rate for popular products, stranded inventory percentage, and inventory age. Sellers with scores consistently above 500 typically maintain healthy capacity limits. Those dropping below 400 face restrictions.

According to a Seller Central forum discussion from August 2025, one seller reported their limit suddenly dropping to 186.90 cubic feet despite having 213.13 cubic feet already in use. This immediately blocked all replenishment, even for top-selling products, with an IPI of 616 and strong metrics across other dimensions.

These situations highlight how the system can malfunction or apply restrictions that don’t align with visible performance metrics. Seller support often struggles to explain sudden capacity drops or provide paths to resolution beyond generic advice to improve IPI scores.

The performance-based structure creates incentives for specific behaviors. Sellers focus more intensely on sell-through rates, removing slow-moving inventory to avoid excess inventory penalties. They monitor stranded listings aggressively, knowing that unfulfillable inventory counts against their score without generating sales.

Improving IPI for Better Capacity

Sellers can influence their IPI scores through concrete actions. Reducing excess inventory means identifying slow sellers and either running promotions to clear them, removing them from FBA, or liquidating through Amazon’s outlet programs.

Maintaining high in-stock rates on best sellers requires accurate demand forecasting and buffer inventory. But this creates tension with the monthly capacity system—carrying buffer stock consumes capacity that could go to other products.

Fixing stranded inventory provides quick IPI improvements. Stranded units sit in fulfillment centers without active listings, often due to listing errors, suppressed ASINs, or closed listings. The Stranded Inventory tool in Seller Central identifies these issues and guides resolution.

Managing inventory age means monitoring how long products remain at FBA. Items over 365 days incur long-term storage fees and hurt IPI scores. Sellers track aging inventory reports and take action before units hit these thresholds.

Some sellers game the system by removing inventory before it ages into penalty zones, then shipping it back later. This increases costs but may preserve capacity access worth more than the handling fees.

Feature #4: Capacity Reservation Through Competitive Bidding

The reservation fee system within Capacity Manager creates a marketplace for FBA space. Rather than administrative decisions determining who gets additional capacity, Amazon allocates it based on what sellers will pay.

Sellers submit reservation fee bids specifying dollars per cubic foot for the extra capacity they request. Amazon ranks these bids and grants requests from highest to lowest until available capacity exhausts. Sellers with winning bids see their capacity limits increase accordingly.

The official announcement notes that reservation fees get offset by performance credits. The exact mechanism for earning these credits ties to IPI scores and inventory efficiency metrics. High-performing sellers effectively pay less for additional capacity through credit offsets.

This creates a two-tier system. Sellers with strong performance metrics and willingness to pay reservation fees can secure ample capacity. Those with lower IPI scores or tighter margins face constrained access, potentially limiting growth.

The competitive dynamic intensifies seasonally. During Q4, when sellers need maximum capacity for holiday inventory, reservation fee bids spike as sellers compete for limited additional space. Off-peak months see less competition and lower clearing prices.

Economics of Capacity Reservation

Sellers evaluating reservation fees must calculate break-even points. The cost per cubic foot needs weighing against potential revenue from products that would otherwise face stockouts.

A simple formula helps: take product margin per unit, multiply by units per cubic foot, and compare against the reservation fee. If a cubic foot of product generates $50 in margin monthly and the reservation fee is $10, the economics favor requesting additional capacity.

This calculation shifts dramatically by product category. Small, high-margin items like jewelry or cosmetics may justify high reservation fees. Large, low-margin products like furniture or appliances rarely make economic sense for paid capacity increases.

Timing matters too. Reservation fees paid for capacity used during high-demand months yield better returns than off-peak periods. Sellers strategically time their additional capacity requests around promotional calendars.

Some sellers view reservation fees as simply another cost of doing business on FBA, incorporating them into landed cost calculations. Others see them as evidence of Amazon squeezing sellers, essentially charging for capacity that should be included in standard FBA fulfillment fees.

Comparison of Amazon's old dual-limit FBA system versus the new streamlined monthly capacity management approach implemented in March 2023

How the New System Affects Different Seller Types

The capacity management changes impact sellers differently based on business models, product categories, and operational sophistication.

High-volume sellers with strong IPI scores generally benefit from the new system. Monthly limits provide better visibility for planning large purchase orders and coordinating international shipments. The ability to request additional capacity through Capacity Manager gives these sellers tools to scale during peak periods.

Small sellers or those just starting with FBA often struggle more. Base capacity allocations for newer accounts start low, requiring time and sales history to build up. Without track records demonstrating strong inventory management, these sellers face tighter constraints.

Private label brands managing multiple SKUs encounter specific challenges. Capacity gets allocated as a total across all products, forcing difficult decisions about which items to prioritize. A brand with 50 SKUs might lack capacity to keep everything in stock simultaneously, requiring strategic choices about core versus secondary products.

Seasonal sellers face particular pain points. Those with concentrated sales periods need capacity precisely when competition for additional allocation peaks. A toy seller ramping up for Q4 or a graduation gift seller preparing for May need extra space during high-demand windows when reservation fees run highest.

International Sellers and Long Lead Times

Sellers sourcing from overseas manufacturers face mathematical problems with the capacity system. Products manufactured in Asia typically require 60-90 days from order to FBA check-in when using ocean freight.

Community discussions highlight the bind this creates. One seller noted their Canada FBA capacity covers only 70 days of inventory despite 60-day shipping times. Even with perfect efficiency, the math doesn’t allow maintaining continuous stock availability.

These sellers need capacity to cover goods in transit plus safety stock for demand variability plus buffer for manufacturing and shipping delays. When monthly limits provide barely enough for current inventory turnover, the system forces stockouts or expensive air freight to manage gaps.

The alternative many adopt: using Amazon Warehousing and Distribution (AWD) or third-party logistics providers (3PLs) as primary storage, with FBA serving as a just-in-time fulfillment layer. This hybrid approach addresses capacity constraints but adds complexity and cost.

Launching More Inventory Through FBA? Make Sure Your Ads Keep Up

New FBA capacity management features can make it easier to send more inventory into Amazon’s fulfillment network. But when stock levels increase, sellers often need better visibility into advertising performance to make sure those products actually move.

WisePPC helps sellers track the relationship between ads, sales, and inventory in one place. By connecting Amazon Ads and seller account data, the platform imports campaign metrics, keyword performance, and sales history into a single dashboard so you can see what is driving demand.

If you are scaling inventory through FBA, WisePPC can help you:

  • monitor Amazon PPC performance across campaigns and products
  • analyze historical advertising and sales data
  • adjust bids, budgets, and campaigns from one interface

Integration with Amazon Warehousing and Distribution

Amazon Warehousing and Distribution emerged as a strategic complement to the tighter FBA capacity system. AWD offers bulk storage at rates that can provide substantially lower storage costs compared to FBA, with automatic replenishment to FBA as products sell.

According to information from seller resources, inventory routed through AWD to FBA via auto-replenishment doesn’t count against FBA capacity limits for the shipment itself. However, once units check into FBA fulfillment centers, they do count against capacity allocations.

This creates a powerful workflow for sellers with capacity constraints. Store months of inventory at AWD at low cost, then let Amazon’s system automatically push units to FBA in quantities matched to sales velocity and available capacity.

The economics work especially well for sellers with product catalogs mixing fast and slow movers. Store everything at AWD, let high-velocity items flow continuously to FBA, and keep slower SKUs in cheap storage until demand justifies FBA placement.

Community questions reveal confusion about the interaction between AWD and FBA limits. One seller with footwear capacity issues questioned whether AWD auto-replenishments filling their footwear capacity would block direct shipments of other footwear from their own warehouse to FBA.

The answer highlights system complexity: AWD shipments don’t consume capacity when initiated, but they do once inventory checks in. Sellers need to account for AWD auto-replenishment volumes when planning direct shipments to avoid exceeding limits.

Capacity Monitor and Dashboard Tools

Amazon provides the Capacity Monitor as the primary interface for tracking limits and usage. Located on the FBA Dashboard in Seller Central, it displays current capacity by storage type, usage levels, and available space.

The monitor updates throughout the month as inventory dynamics change. Sales that ship out immediately free capacity for new shipments. Shipments checking in at fulfillment centers consume available capacity.

Sellers can view future capacity allocations, typically seeing projections for upcoming months. This advance visibility enables planning for procurement and marketing initiatives.

The Capacity Monitor also provides the entry point for Capacity Manager requests. Sellers can submit requests for additional capacity directly from the dashboard, specifying amounts and reservation fees.

According to the official refresher post from March 2024, sellers should regularly check the Capacity Monitor to understand their limits and plan accordingly. The post emphasizes using the tool to track capacity usage and identify when requests for additional space make sense.

Storage Type Categories

FBA capacity divides into separate categories: standard-size, oversize, apparel, footwear, flammable, and aerosol. Each category receives its own capacity limit, with usage in one category not affecting availability in others.

This segmentation helps and hinders different sellers. A footwear brand benefits from having dedicated footwear capacity that doesn’t compete with standard inventory. But the same seller can’t reallocate unused standard capacity to footwear when footwear limits constrain their primary business.

Product classification determines which capacity bucket inventory consumes. Sellers need accurate product dimensions and attributes to ensure proper categorization. Misclassified products may get assigned to wrong capacity types, creating unexpected constraint issues.

Some categories face tighter limits than others based on fulfillment center capacity and demand patterns. Footwear and apparel sellers particularly report capacity challenges, with community discussions showing sellers hitting category limits while having unused capacity in other types.

Common Capacity Management Challenges

Sellers encounter recurring issues with the capacity system. Understanding these challenges helps develop strategies to minimize their impact.

ASIN-level restock limits represent a particularly frustrating constraint. A seller might have overall category capacity available but face blocks on specific ASINs. According to community discussions, this isn’t a bug but a deliberate feature—Amazon managing FBA as a just-in-time network rather than long-term storage.

These ASIN limits can throttle best-sellers unpredictably. A top-performing product might suddenly show restricted restocking capacity despite healthy overall limits. Sellers report situations where their #1 SKU by revenue gets blocked from replenishment while slower products have open capacity.

Capacity reductions below current usage create immediate crises. When limits drop beneath inventory already in the system, sellers face complete blocks on new shipments until usage falls back below limits. This happens through IPI score declines, Amazon capacity adjustments, or category rebalancing.

One seller recounted their limit suddenly dropping to 186.90 cubic feet with 213.13 cubic feet already in use. Despite an IPI of 616 and strong metrics, the reduction blocked all replenishment. Seller Support couldn’t resolve the issue or escalate properly, leaving the seller unable to restock even top performers.

System Inconsistencies and Support Gaps

Sellers report capacity system behaviors that don’t align with stated policies or visible metrics. Limits might decrease despite improving IPI scores. Capacity allocations can vary dramatically between similar sellers with comparable performance.

Seller Support frequently struggles to explain capacity issues or provide actionable solutions. Representatives often fall back on generic advice—improve your IPI score, remove excess inventory—without addressing specific situations where metrics already look strong.

The lack of transparency around capacity calculation formulas frustrates sellers trying to optimize their approach. Amazon doesn’t publish the exact algorithm determining limits, making it difficult to diagnose why capacity decreased or predict future allocations.

Some sellers suspect capacity reductions relate to overall fulfillment center space constraints rather than individual performance. When Amazon needs to free warehouse space, they may reduce seller limits regardless of IPI scores, using performance metrics as convenient justification.

Challenge Impact Mitigation Strategy
ASIN-level restock limits Best-sellers blocked despite overall capacity Diversify product mix, use AWD buffer storage
Capacity below current usage All shipments blocked until inventory sells down Maintain IPI above 500, monitor limits weekly
Category-specific constraints Can’t reallocate unused capacity between types Balance catalog across categories, optimize mix
Unpredictable limit changes Planning disrupted by sudden reductions Build external safety stock, use 3PL backup
Long manufacturing lead times Math doesn’t support continuous availability Hybrid model with AWD or 3PL primary storage
Seasonal capacity competition High reservation fees during Q4 peaks Request additional capacity early, lock in space

Strategic Adaptations Sellers Are Making

Successful sellers adapted their operations to work within the new capacity constraints. Several strategies emerged as best practices.

The hybrid storage model became standard for many sellers. Rather than sending all inventory to FBA, they use AWD or 3PLs as primary storage buffers. FBA receives frequent smaller shipments timed to sales velocity and available capacity.

This approach requires more logistics coordination but solves the capacity math problem. A seller can store 120 days of inventory externally while maintaining only 45-60 days at FBA. As products sell, new shipments flow from buffer storage to FBA in quantities matching consumption and available capacity.

Inventory turnover optimization climbed to top priority. Sellers analyze product velocity more rigorously, removing or liquidating slow movers to free capacity for high performers. The focus shifts from maximizing SKU count to maximizing revenue per cubic foot of capacity.

Some sellers consolidated SKUs, discontinuing marginal products to concentrate capacity on proven winners. Others adjusted their product development approach, favoring smaller, higher-margin items that generate more revenue per unit of capacity consumed.

IPI Management as Core Competency

Maintaining high IPI scores evolved from background metric to strategic imperative. Sellers implemented systematic processes to monitor and optimize the four IPI components.

For excess inventory management, sellers run weekly reports identifying slow movers before they become problematic. Products approaching 90+ days of supply get flagged for promotional action or removal.

In-stock rate optimization requires better demand forecasting and buffer stock management. Sellers balance the tension between carrying enough inventory to avoid stockouts while not tying up capacity in excessive safety stock.

Stranded inventory gets monitored daily rather than weekly. Any listing errors, suppression issues, or closed listings trigger immediate action to restore sellability and remove the IPI penalty.

Age management means tracking cohorts of inventory by receive date. Products approaching long-term storage thresholds get targeted for clearance promotions or removal before hitting fee triggers and IPI impacts.

Capacity Planning and Forecasting

The monthly capacity system demands more sophisticated planning than sellers previously employed. Those treating inventory management casually struggle; those developing robust forecasting processes adapt successfully.

Effective planning starts with accurate sales forecasting by SKU. Historical sales data provides baseline expectations, adjusted for seasonality, trends, and upcoming promotions. Forecasts need monthly granularity at minimum, weekly for high-velocity products.

From sales forecasts, sellers calculate capacity requirements. Each product’s volume per unit, multiplied by forecasted unit sales, determines cubic footage needed. Summing across SKUs by storage category produces total capacity requirements against which current limits get compared.

When requirements exceed limits, sellers face strategic choices: request additional capacity through Capacity Manager, reduce SKU count, shift storage to AWD/3PL, or accept planned stockouts on lower-priority items.

Lead time management becomes critical in capacity planning. Long manufacturing or shipping lead times require committing to capacity allocation months in advance. Purchase orders placed in July for October delivery need accounting for in current capacity planning, even though products won’t arrive for months.

Scenario Planning and Contingencies

Sophisticated sellers develop multiple inventory scenarios rather than single plans. Best-case, expected, and worst-case scenarios help prepare responses to capacity changes.

Contingency planning addresses questions like: What if our capacity limit decreases 20% next month? Which SKUs get prioritized? What products move to external storage? What air freight budget covers emergency replenishment?

These plans can’t prevent capacity challenges but enable faster responses when issues arise. Rather than scrambling reactively, sellers execute predetermined playbooks.

Some sellers maintain relationships with 3PLs even when primarily using FBA, treating external fulfillment as insurance. If FBA capacity becomes insufficient, they can quickly shift SKUs to 3PL fulfillment without scrambling to establish new vendor relationships.

The Broader Context: Amazon’s Strategic Direction

The capacity management changes reflect Amazon’s strategic evolution of FBA from general-purpose warehousing to optimized fulfillment network. Understanding this context helps sellers anticipate future developments.

Amazon wants fulfillment centers functioning as distribution hubs with rapid inventory turnover, not long-term storage facilities. Higher velocity through the network improves capital efficiency and enables faster customer delivery.

The shift toward performance-based capacity allocation aligns seller incentives with Amazon’s operational goals. Sellers maintaining lean, fast-turning inventory get rewarded with more capacity. Those treating FBA as cheap warehousing face restrictions.

According to Amazon Accelerate 2025 announcements, Amazon will discontinue the FBA commingling practice. This gives brand owners greater control over their inventory and is estimated to save sellers $600 million annually in stickering costs.

The trend points toward FBA becoming increasingly selective rather than universally available. Access depends on performance metrics and willingness to pay premium fees for guaranteed capacity.

Impact on Different Product Categories

Capacity constraints affect product categories differently based on physical characteristics and demand patterns.

Small, lightweight products with high margins—jewelry, cosmetics, supplements—adapt most successfully. These items consume minimal capacity per dollar of revenue, making efficient use of allocated space. Sellers can maintain full catalog availability even with modest capacity limits.

Large, bulky products face harder math. Furniture, large appliances, bulk commodity goods consume capacity quickly relative to revenue generated. Sellers in these categories find capacity constraints most binding.

Apparel and footwear sellers report particular challenges based on community discussions. These categories have dedicated capacity allocations that often run tighter than standard inventory limits. Seasonal buying patterns create demand surges that strain capacity during peak periods.

Fast-moving consumer goods (FMCG) with predictable demand work reasonably well with monthly limits. Sellers can forecast consumption accurately and schedule replenishments to match. Capacity turns over quickly, freeing space for new shipments.

Products with lumpy, unpredictable demand create planning difficulties. When sales spike unexpectedly, sellers may lack capacity to respond quickly, resulting in lost sales during high-demand periods.

Three-phase optimization framework for managing FBA capacity effectively under the new monthly limit system

Looking Ahead: Future Capacity System Evolution

Amazon continues refining the capacity management system. Sellers should anticipate further evolution based on recent patterns and strategic direction.

The trend toward tighter integration between capacity and performance metrics will likely intensify. Amazon may introduce additional performance factors beyond IPI that influence capacity allocations, rewarding behaviors aligned with operational efficiency.

Dynamic capacity pricing could expand beyond the current reservation fee system. Rather than static monthly limits with optional paid increases, Amazon might implement surge pricing for capacity during peak periods, with rates adjusting based on supply and demand.

Automation will play increasing roles. Amazon continues investing in AI tools for sellers, as highlighted at Amazon Accelerate 2025 with announcements around “Agentic AI” that can reason, plan, and take action. Future versions might auto-optimize inventory distribution between AWD and FBA based on sales velocity and capacity constraints.

Category-specific rules may proliferate. Different product types have different fulfillment economics and space requirements. Amazon might implement specialized capacity policies for hazmat, oversize, or other categories requiring particular handling.

Conclusion: Adapting to the New FBA Capacity Reality

Amazon’s streamlined FBA capacity management system replaced confusing dual limits with clearer monthly allocations. The four key features—unified monthly limits, Capacity Manager for additional storage, performance-based increases, and competitive reservation bidding—give sellers better planning tools while tying capacity access to inventory performance.

But clarity doesn’t mean simplicity. The system creates new challenges, particularly for sellers with long lead times, seasonal demand patterns, or products in constrained categories. Success requires treating capacity as a strategic resource to optimize rather than an unlimited utility.

The sellers thriving under the new system share common approaches: obsessive IPI management, hybrid storage models combining FBA with AWD or 3PLs, data-driven forecasting, and proactive rather than reactive planning. They monitor capacity daily, act on performance metrics weekly, and forecast needs months ahead.

Amazon’s direction is clear—FBA evolves toward a premium just-in-time fulfillment network rather than general warehousing. Access depends on performance and potentially willingness to pay for guaranteed capacity. Sellers treating FBA as cheap long-term storage increasingly find themselves constrained.

The capacity system will continue evolving. Sellers need to stay informed about policy changes, adapt strategies as Amazon refines the system, and build operational flexibility to adjust quickly when capacity dynamics shift.

Ready to optimize your FBA capacity management? Start by checking your current IPI score and capacity usage in Seller Central’s Capacity Monitor. Identify which performance areas need improvement, calculate your actual capacity needs accounting for lead times, and develop a strategy that aligns your inventory flow with Amazon’s monthly capacity structure. The sellers who adapt fastest will maintain competitive advantages through reliable product availability while others struggle with constraints.

Frequently Asked Questions

How often do FBA capacity limits change?

FBA capacity limits refresh monthly, though Amazon can adjust allocations mid-month based on performance changes or fulfillment center capacity constraints. Sellers typically see their next month’s capacity projection a few weeks in advance through the Capacity Monitor. The limits account for current IPI scores, sales forecasts, and historical performance. Significant IPI score drops can trigger immediate capacity reductions, even within the current month. Sellers should check the Capacity Monitor at least weekly to catch any unexpected changes before they impact shipping plans.

What IPI score do I need to avoid capacity restrictions?

Amazon recommends maintaining an IPI score above 500 to access optimal capacity limits. Scores between 400-500 typically result in reduced capacity allocations but not severe restrictions. Scores below 400 trigger aggressive capacity constraints and potentially limit creation of new listings. The exact capacity impact varies by individual account factors beyond just IPI score. Generally speaking, sellers with scores consistently above 500 report fewer capacity-related issues and better access to additional capacity through Capacity Manager requests.

Does inventory shipped from AWD to FBA count against my capacity limits?

Inventory transferring from Amazon Warehousing and Distribution to FBA through auto-replenishment doesn’t count against capacity limits during the shipment itself. However, once units check into FBA fulfillment centers, they do count toward capacity usage. This means sellers can store large quantities at AWD without consuming FBA capacity, but need to account for auto-replenishment volumes in their FBA capacity planning. AWD-to-FBA transfers consume available FBA capacity just like direct shipments from external sources once they arrive.

Can I request additional capacity for specific ASINs?

Capacity Manager requests apply to storage type categories (standard, oversize, apparel, footwear, etc.) rather than specific ASINs. Sellers can’t request additional capacity targeted to particular products. However, ASIN-level restock limits sometimes prevent replenishment of specific products even when category capacity shows availability. These ASIN restrictions reflect Amazon’s inventory distribution preferences and generally can’t be overridden through Capacity Manager. Sellers facing ASIN-level limits often need to use AWD or 3PL storage as buffers, sending smaller frequent shipments as ASIN restrictions allow.

What happens if my capacity limit drops below my current inventory level?

When capacity limits fall below current usage, Amazon blocks all new shipments until usage decreases to within limits. This can happen through IPI score declines, capacity adjustments, or category rebalancing. Existing inventory remains at FBA and continues fulfilling orders normally—the restriction only prevents new shipments. Sellers in this situation must wait for inventory to sell down or remove units to create space. Seller Support typically cannot override these restrictions manually. The best prevention is maintaining IPI scores above 500 and avoiding situations where usage runs at or near limits.

How do I calculate how much capacity I need?

Calculate capacity needs by multiplying each SKU’s dimensions (length × width × height in inches, divided by 1,728 to convert to cubic feet) by the units needed on hand. Sum across all SKUs in each storage category to determine total cubic feet required. Account for safety stock to handle demand variability, plus inventory in transit that will arrive and consume capacity. Compare required capacity to allocated limits. The calculation should project 60-90 days ahead to align with typical procurement and shipping lead times. When requirements exceed limits, evaluate Capacity Manager requests or hybrid storage models.

Is using reservation fees through Capacity Manager worth it?

Reservation fees make economic sense when the cost per cubic foot is substantially lower than profit generated by products in that space. Calculate your product’s margin per cubic foot per month, then compare against reservation fees. High-margin, fast-turning products easily justify reservation fees. Low-margin or slower items may not. Consider reservation fees as insurance against stockouts during peak periods—the cost of missed sales during high-demand windows often exceeds the fees. Time requests strategically around promotional calendars and seasonal peaks when the revenue impact of having adequate inventory is highest.

Amazon Selling Fees Explained: Complete 2026 Cost Guide

Quick Summary: Amazon sellers pay multiple fees including a selling plan fee ($39.99/month for Professional or $0.99 per item for Individual), referral fees (typically 8-15% per sale depending on category), and optional FBA fulfillment fees for storage and shipping. Additional costs may include storage fees, advertising, and various service charges.

Understanding Amazon’s fee structure can feel like decoding a puzzle. And honestly? The platform doesn’t make it simple.

But here’s the thing: knowing exactly what Amazon charges is the difference between running a profitable business and wondering where all the money went. Every seller, from someone moving five items a month to established brands shipping thousands, encounters the same fee categories.

The cost structure breaks into two buckets: mandatory fees that every seller pays, and optional fees for services like Fulfillment by Amazon or advertising. Some fees changed recently, others stayed flat, and new programs launched that affect what sellers actually pay in 2026.

So what does it really cost to sell on Amazon?

The Two Core Fees Every Amazon Seller Pays

Before diving into optional services and specialized programs, two fee types apply to absolutely every seller on the platform.

Selling Plan Fees: Individual vs Professional

Amazon offers two selling plans, and the choice impacts both monthly costs and available features.

The Individual plan costs $0.99 per item sold with no monthly subscription. Someone selling 20 items pays $19.80 that month. Selling 100 items? That’s $99 in per-item fees.

The Professional plan charges $39.99 monthly regardless of sales volume. No per-item fee exists. Sellers moving more than 40 items monthly typically save money with this plan.

But cost isn’t the only difference. Professional sellers get bulk listing tools, advertising options, and access to advanced selling features. Individual sellers can’t run Amazon Ads campaigns or use bulk inventory management.

According to Amazon’s Seller Central documentation, the Professional plan provides access to advanced tools and programs unavailable to Individual sellers. That monthly subscription unlocks the full platform.

Referral Fees: Amazon’s Commission on Every Sale

Every single sale triggers a referral fee. Think of it as Amazon’s commission for connecting sellers with buyers.

The percentage varies by product category. Most categories fall between 8% and 15% of the total sale price (including the item price plus shipping charges in most cases).

Here’s where it gets specific. Electronics accessories carry a 15% referral fee. Business and industrial supplies increased to 11% from 10% in recent updates. The referral fee for Major Appliances is 8% for the portion of the total sales price greater than $300, and 15% for the portion up to $300. For Televisions, the referral fee is a flat 8%.

Amazon calculates referral fees on the total amount the customer pays, not just the item’s list price. So a $25 product with $5 shipping generates a referral fee on the full $30.

Some categories have minimum referral fees too. Even if 15% of a sale equals $0.20, Amazon might charge a $0.30 minimum for that category.

Common Amazon referral fee percentages across major product categories, with recent 2025 adjustments shown

Fulfillment by Amazon (FBA) Fees: What Storage and Shipping Cost

FBA is optional. But it’s also what most serious sellers use.

Amazon stores inventory in their warehouses, picks and packs orders, ships products to customers, and handles returns. Convenient, yes. Free? Absolutely not.

FBA Fulfillment Fees: Pick, Pack, and Ship

Every time Amazon ships a product for a seller, a fulfillment fee applies. The fee depends on size tier and weight.

Small standard-size items under 10 ounces might cost $3.07 to fulfill. Large standard-size items between one and two pounds could run $4.90. Large bulky items get expensive fast—some oversized products cost $25+ per fulfillment.

Amazon adjusts these fees periodically. Recent updates lowered inbound placement service fees for large bulky products by an average of $0.58 per unit for minimal shipment splits, effective January 2025.

The fee structure rewards smaller, lighter products. A book that weighs 12 ounces and sells for $20 costs far less to fulfill than a 15-pound kitchen appliance selling for the same price.

Monthly Storage Fees: Rent for Warehouse Space

Inventory sitting in Amazon’s warehouses incurs monthly storage fees based on cubic footage.

Standard-size items stored from January through September cost less per cubic foot than during October through December peak season. The rates increase substantially in Q4 when warehouse space becomes premium real estate.

Long-term storage fees hit products that sit unsold for extended periods. Amazon wants fast-moving inventory, not dead stock taking up space.

According to recent Amazon announcements, sellers should monitor inventory age carefully. Slow-moving stock doesn’t just gather dust—it generates escalating storage charges.

The New FBA Liquidations Program

Amazon launched a liquidations program in 2026 to help sellers recover value from excess and returned inventory.

The program charges a 15% referral fee plus per-item processing fees based on size and weight. For items 0-5 kg, processing fees range from CAD $0.25 to CAD $1.90 (Canada-specific rates) (in Canada; US fees differ slightly).

This provides an exit strategy for inventory that won’t sell at regular prices. Better to recover something than pay mounting long-term storage fees.

Want to See Where Your Amazon Ad Spend Actually Goes?

Selling on Amazon involves multiple costs – referral fees, FBA fees, storage, and advertising. For many sellers, Amazon PPC becomes one of the largest ongoing expenses, but it is often the hardest to track clearly inside the standard dashboards.

WisePPC helps sellers understand how advertising spend fits into the overall cost of selling on Amazon. The platform connects Amazon Ads and Seller Central data, allowing you to analyze campaign performance, review historical metrics, and manage campaigns from one interface.

If you want better visibility into your Amazon advertising costs, WisePPC can help you:

  • track PPC spend alongside sales performance
  • identify campaigns that waste budget
  • manage and optimize Amazon ads more efficiently

See how your advertising costs impact profitability.

Optional Fees and Additional Services

Beyond the core costs, Amazon offers services that carry their own fee structures.

Inbound Placement Service Fees

When shipping inventory to Amazon, sellers can either split shipments across multiple warehouses (cheaper) or pay for Amazon to distribute inventory from a single shipment (more convenient).

The inbound placement service fee covers Amazon’s work redistributing products across their fulfillment network. Fees vary by size and shipment split level.

Recent changes lowered these fees for large bulky items, making it more affordable to use minimal shipment splits rather than sending products to multiple locations.

Removal and Disposal Fees

Need to get inventory out of FBA? Removal fees apply.

Amazon charges per item to return unsold products to sellers. Disposal fees apply if products are destroyed instead of returned. The fees scale with item size.

Many sellers forget these exist until they need to clear out seasonal inventory or discontinued products. Planning for these costs matters.

Advertising Costs: Sponsored Products and Beyond

Amazon Ads are entirely optional but increasingly necessary for visibility.

Sponsored Products, Sponsored Brands, and Sponsored Display ads all operate on pay-per-click models. Sellers set budgets and bid on keywords. Costs vary wildly by competition—some clicks cost $0.25, others $5+.

Only Professional plan sellers can access advertising tools. Individual sellers don’t get this option at all.

Coupon and Promotion Fees

Running a coupon promotion? Amazon charges a $0.60 fee per redeemed coupon.

Percentage-off promotions, buy-one-get-one deals, and other promotional tools might carry fees too. The costs add up if promotional redemptions run high.

According to Amazon’s official documentation on coupon fees, these charges cover the cost of promoting products through Amazon’s coupon programs.

Refund Administration Fees

When customers return items, Amazon refunds most of the referral fee to sellers. But not all of it.

A small refund administration fee gets retained. It’s not huge per transaction, but in categories with high return rates, these fees accumulate.

High-return categories like apparel see this more than others. Someone selling shoes might deal with 15-20% return rates. Those administration fees become part of the cost model.

Fee Type Who Pays Typical Cost When It Applies
Individual Plan Fee Individual sellers $0.99 per item sold Every sale
Professional Plan Fee Professional sellers $39.99/month Monthly subscription
Referral Fee All sellers 8-15% of sale price Every sale
FBA Fulfillment Fee FBA sellers only $3-$25+ per item Per fulfillment
Monthly Storage Fee FBA sellers only Varies by cubic foot Monthly for stored inventory
Removal/Disposal Fee FBA sellers Varies by size When removing inventory
Coupon Fee Sellers using coupons $0.60 per redemption Per coupon redeemed

Calculating Your True Amazon Selling Costs

Understanding individual fees matters. But what do they look like combined?

Real talk: most sellers find total fees consume 30-50% of revenue depending on product type, fulfillment method, and business model.

Example Cost Breakdown for a $25 Product

Consider a seller using FBA for a standard-size product priced at $25:

  • Item price: $25.00
  • Referral fee (15%): -$3.75
  • FBA fulfillment fee: -$3.07
  • Monthly storage (averaged per unit): -$0.01
  • Shipping to Amazon: -$0.30
  • Net before product cost: $17.87

If the product costs $10 to source or manufacture, the actual profit drops to $7.87 per unit—just 31.5% margin.

And that’s before advertising spend, which many sellers need to maintain visibility.

FBA vs FBM: The Cost Difference

Fulfillment by Merchant (FBM) sellers handle shipping themselves. They avoid FBA fulfillment and storage fees.

But they also handle customer service, manage returns, and don’t get automatic Prime badge eligibility. Plus they need their own shipping infrastructure.

The calculation isn’t just about Amazon’s fees. It’s about total operational costs. Someone paying $4 in FBA fees might spend $2 shipping themselves—but also invest in warehouse space, staff, and packing materials.

Many sellers find FBA more cost-effective despite higher per-unit fees because it scales without proportional labor increases.

Key cost and benefit differences between Amazon's two fulfillment methods

Recent Fee Changes and What They Mean

Amazon adjusts fees regularly. Staying current matters.

2025 and 2026 Updates

For 2025 and 2026, Amazon announced no increases to Canada referral and FBA fees, and for 2025 in the US, no increases to referral and FBA fees. This marked a departure from annual increases sellers had come to expect.

Some specific changes did occur:

  • Business, industrial, and scientific supplies category referral fees increased to 11% from 10% in August 2025
  • Major appliances and televisions saw referral fees rise to 8%
  • Inbound placement service fees for large bulky-size products were lowered an average of $0.58 per unit for minimal shipment splits, effective January 15, 2025
  • The new FBA Liquidations program launched with specific fee structures

According to official Amazon Seller Central announcements from late 2024, the company emphasized investments in fulfillment infrastructure, faster delivery capabilities, and improved inventory management tools rather than broad fee increases.

Low-Price Product Fee Adjustments

Amazon maintained lower fulfillment fees for low-priced products and reduced referral fees for low-priced apparel items.

These adjustments help sellers compete in price-sensitive categories where margins run thin. Selling a $10 t-shirt becomes viable when fees stay proportional.

Strategies to Minimize Amazon Selling Costs

Understanding fees is step one. Optimizing around them is step two.

Choose the Right Selling Plan

The math is straightforward. Selling more than 40 items monthly? Professional plan saves money and unlocks features.

But don’t upgrade prematurely. New sellers testing products might sell 15 items in month one. That $39.99 subscription plus referral fees hurts when sales haven’t ramped yet.

Optimize Product Size and Weight

FBA fees reward compact, lightweight products.

Two products with identical $30 sale prices might have wildly different profitability. The one weighing 8 ounces costs $3 to fulfill. The one weighing 3 pounds costs $6. That’s $3 extra per unit straight off the bottom line.

Product selection matters. Experienced sellers factor fulfillment costs into sourcing decisions, not as an afterthought.

Manage Inventory Age

Long-term storage fees punish slow-moving inventory.

Smart sellers monitor inventory age reports and make decisions before fees escalate. Running a promotion to move 90-day-old stock costs less than paying months of increasing storage charges.

The new liquidations program provides another option for clearing aged inventory with some value recovery.

Use Fee Calculators Before Launching Products

Amazon provides revenue calculators that preview fees for specific products.

Testing profitability before buying inventory prevents expensive mistakes. Enter the product ASIN, estimated sales price, and costs. The calculator shows expected fees and net profit.

This tool exists in Seller Central and should be mandatory for every product evaluation.

Consider FBM for Specific Products

Not everything belongs in FBA.

Large items, fragile products with high damage rates, or slow-moving specialty goods might work better with merchant fulfillment. Avoiding storage fees and fulfillment costs for a $200 item that sells twice monthly could save substantial money annually.

The trade-off is handling logistics. But for some products and sellers, it makes financial sense.

Hidden Costs Sellers Often Overlook

The published fee schedule doesn’t tell the whole story.

Returns and Refunds

High return rates effectively increase all costs. A product with 20% returns needs 20% higher margins to maintain profitability.

Amazon keeps refund administration fees. Sellers also potentially lose the product if it comes back damaged. Some categories see return rates above 30%.

Stranded Inventory Costs

Inventory that becomes unsellable due to listing errors, compliance issues, or quality problems still incurs storage fees.

Resolving these issues takes time. Meanwhile, storage fees keep accruing for products generating zero sales.

Advertising as a Practical Necessity

Technically optional, advertising often becomes necessary for visibility.

Organic ranking requires sales velocity. Getting initial sales often requires advertising. The cost isn’t listed as mandatory, but many sellers find it functionally required.

Advertising costs vary enormously by category and competition. Some sellers spend 5% of revenue on ads. Others spend 30%+.

Amazon Fees Compared to Other Marketplaces

How do Amazon’s costs stack up?

eBay charges final value fees typically between 10-15% plus payment processing around 2.9%. No monthly subscription for basic selling, but promoted listings cost extra.

Walmart Marketplace charges referral fees between 6-20% depending on category. No monthly fee, but approval requirements are stricter.

Shopify costs $29-299 monthly for the platform plus payment processing (2.4-2.9% + $0.30 per transaction for Shopify Payments). No referral fees, but sellers handle all marketing and customer acquisition.

Amazon’s total costs might run higher per transaction, but the platform delivers traffic other channels don’t. That traffic has value sellers need to factor into comparisons.

Regulatory Considerations and Transparency

Selling online involves more than just marketplace fees.

The INFORM Consumers Act, effective as of June 27, 2023, requires online marketplaces to collect and verify information from high-volume third-party sellers. Sellers meeting specific thresholds in any continuous 12-month period must provide tax identification, contact information, and bank account details.

According to FTC guidance, the law aims to prevent stolen goods and counterfeit products from being sold through online marketplaces. While this doesn’t directly create fees, non-compliance can result in account suspension.

The FTC’s Rule on Unfair or Deceptive Fees also impacts how sellers can display prices. Total prices must include all mandatory fees and charges. This applies more to end-customer pricing than Amazon’s seller fees, but sellers should understand transparency requirements.

Making Sense of Amazon’s Fee Structure

Here’s what it comes down to: Amazon’s fees are substantial, but predictable once understood.

The platform charges for access to its customer base, fulfillment infrastructure, and marketplace tools. For many sellers, these costs deliver value that exceeds alternatives—but only when managed strategically.

Successful sellers treat fees as controllable variables, not fixed costs. Product selection, inventory management, pricing strategy, and fulfillment choices all impact total fees paid. Small optimizations compound over thousands of transactions.

Start with the basics: understand referral fees for target categories, calculate break-even pricing including all applicable fees, and choose the selling plan that matches sales volume. Then layer in FBA decisions based on product characteristics and business model.

The sellers who profit on Amazon aren’t necessarily those with the lowest fees. They’re the ones who understand exactly what they’re paying, why, and how each fee impacts unit economics. Build that understanding, and Amazon becomes a powerful sales channel rather than a confusing fee maze.

Ready to start selling on Amazon? Calculate your specific costs using Amazon’s fee calculators before listing the first product. Know the numbers, plan for them, and build sustainable margins that account for every fee the platform charges.

Frequently Asked Questions

What is the minimum cost to start selling on Amazon?

The absolute minimum is $0 upfront with the Individual selling plan—no monthly fee required. However, sellers pay $0.99 per item sold plus referral fees on each sale. For someone testing the platform with minimal investment, this structure allows starting with essentially no fixed costs beyond product inventory.

Are Amazon FBA fees tax deductible?

Generally yes. FBA fees, referral fees, subscription costs, and other Amazon selling expenses typically qualify as business expenses for tax purposes. Sellers should consult tax professionals about their specific situations, but these costs normally reduce taxable income just like other cost-of-goods-sold and operational expenses.

How do I calculate if a product will be profitable on Amazon?

Use Amazon’s FBA Revenue Calculator in Seller Central. Enter the product ASIN or dimensions/weight, set the selling price, and input product costs. The calculator shows estimated fees, net proceeds, and margin. For accuracy, include all costs: product cost, shipping to Amazon, prep fees, and estimated advertising spend. Many sellers aim for 30%+ net margins after all fees.

Can I switch from Individual to Professional selling plan mid-month?

Yes, sellers can upgrade from Individual to Professional at any time. Amazon prorates the subscription fee based on when the upgrade occurs. Downgrading from Professional to Individual is also possible, but the monthly fee isn’t refunded for the current billing period. The change takes effect at the start of the next billing cycle.

Do I pay FBA fees if I fulfill orders myself?

No. FBA fees only apply to inventory stored in Amazon’s warehouses and fulfilled by Amazon. Sellers using Fulfillment by Merchant (FBM) avoid FBA fulfillment fees, storage fees, and related FBA charges. They still pay referral fees and selling plan fees, but handle shipping, storage, and returns themselves.

What happens to fees when customers return products?

Amazon refunds most of the referral fee when an order is returned, but keeps a small refund administration fee. FBA fees aren’t refunded. If the returned product is damaged or unsellable, sellers may lose both the product and the fees paid. Return rates vary by category—apparel often sees 15-30% returns while electronics might see 5-10%.

Are there any categories with no referral fees?

No. All product categories on Amazon carry referral fees, though the percentages vary. The lowest rates start around 5% for categories like major appliances and televisions. Most categories fall between 8-15%. Some specialized categories may have unique fee structures, but Amazon charges a commission on every sale regardless of category.

3 Amazon Sellers Who Conquered Challenges in 2026

Quick Summary: Three inspiring Amazon sellers overcame significant challenges to build thriving businesses: Angela Stephens recovered from a $12,500 phishing scam, Moisture Love’s founder pivoted during the pandemic, and Numa Foods successfully rebranded their product. Their stories demonstrate resilience, adaptability, and strategic thinking in the face of business disruptions.

Building a successful Amazon business sounds straightforward until reality hits. Then come the challenges that test every seller’s resolve—phishing scams, global pandemics, trademark disputes, and branding nightmares.

But here’s the thing: some sellers face these obstacles head-on and emerge stronger. Their stories aren’t just inspiring—they’re packed with practical lessons for anyone selling online.

According to the U.S. Small Business Administration, e-commerce sales contributed more than $770 billion to the U.S. economy in 2022, representing about one-fifth of total annual retail sales. Behind these numbers are thousands of individual sellers who’ve navigated their own unique challenges.

Real talk: success on Amazon isn’t about avoiding problems. It’s about how sellers respond when things go wrong.

Angela Stephens: Recovering from a $12,500 Phishing Scam

Angela Stephens runs RE-FOCUS THE CREATIVE OFFICE, and she learned a brutal lesson about cybersecurity the hard way. When placing a product order with a manufacturer, she followed what seemed like standard procedure—wiring $12,500 to the account details provided in an email.

Except those weren’t the real account details.

“They said, ‘You haven’t sent the money.’ I said, ‘Yes, we have,'” Angela recalled. After showing the manufacturer the wire details from her bank, the truth became clear. Scammers had intercepted their communications and sent fake banking information.

The manufacturer threatened to sell the product to other clients. Angela faced losing both her money and her inventory. She ended up sending another $12,500 from her personal funds to secure the order while trying to recover the stolen amount.

The Recovery Strategy

Angela didn’t let this setback define her business. She implemented stronger verification protocols for all financial transactions. Before wiring money, her team now confirms account details through multiple channels—phone calls, verified email addresses, and direct manufacturer contacts.

She also worked with her bank and law enforcement to track the fraudulent transaction. While recovery took time, she eventually recouped a portion of the lost funds.

The experience made her business stronger. She now advocates for other Amazon sellers to implement security measures before they become victims.

The four-stage recovery process Angela Stephens implemented after falling victim to a phishing scam, including prevention measures to protect future transactions.

Moisture Love: Pivoting During the Pandemic

When COVID-19 hit, many Amazon sellers watched their businesses crumble. Supply chains broke. Shipping delays stretched from days to weeks. Customer behavior shifted overnight.

Moisture Love’s founder faced all these challenges while running a beauty and skincare business that relied on consistent product availability and customer trust.

According to source material about Moisture Love’s founder, the pandemic forced a complete operational rethink. Suppliers became unreliable. Fulfillment centers faced capacity limits. Customers worried about product safety and delivery times.

Strategic Adaptation

Instead of waiting for things to return to normal, Moisture Love’s founder made proactive changes. She diversified her supplier base, reducing dependence on any single manufacturer. When Amazon warehouses faced restrictions, she explored alternative fulfillment options.

Communication became critical. She updated product listings with realistic shipping expectations. Customer service responses addressed pandemic-related concerns directly and honestly.

The business also adjusted its product focus. Some skincare items saw increased demand as people invested more in self-care during lockdowns. She prioritized inventory for these high-demand products while scaling back others.

According to the U.S. Small Business Administration, nearly two-thirds of small businesses have gone digital, with e-commerce becoming essential rather than optional. Moisture Love was already online but had to become more agile.

Numa Foods: The Product Naming Challenge

Sometimes the biggest obstacle isn’t money or logistics—it’s finding the right name for a product.

Based on Numa Foods’ story, the company faced challenges with product naming as part of their product launch process. The formulation was perfect. The packaging looked professional. Everything was ready for launch.

Except they couldn’t legally use their original product name.

Trademark conflicts stopped them cold. Another company held rights to their first choice. Their second option had similar issues. Each delay meant lost momentum and additional costs.

The Branding Solution

The team went back to basics. They researched competitor names, analyzed trademark databases, and tested new options with focus groups. They learned that a name needed to be more than available—it had to resonate with target customers.

Numa Foods worked to find a product name that resonated with customers and had proper legal clearance. Before committing, they thoroughly vetted it for trademark issues across multiple jurisdictions.

This process taught them that brand identity matters more than speed to market. A strong, legally sound name protects the business long-term.

Comparison of three different challenge types faced by Amazon sellers and their corresponding solutions.

Common Patterns in Seller Success

These three stories reveal consistent patterns. Successful Amazon sellers don’t avoid challenges—they develop frameworks for handling them.

First, they act quickly. Angela didn’t wait weeks to address the phishing scam. Moisture Love’s founder adapted during the pandemic, not after it ended. Numa Foods pushed through naming issues rather than abandoning their product.

Second, they learn from setbacks. Each challenge became a teaching moment that strengthened their operations. Angela’s security protocols protect against future scams. Moisture Love’s supply chain diversification creates resilience. Numa Foods’ branding process ensures legal compliance.

Third, they maintain perspective. A $12,500 loss could have shut down a business. Instead, it became an investment in better systems. Pandemic disruptions could have ended Moisture Love. Instead, the founder saw opportunities to improve.

Success Factor Angela Stephens Moisture Love Numa Foods
Response Time Immediate action with bank and law enforcement Quick pivot to alternative suppliers Thorough research before next attempt
System Changes Multi-channel verification protocols Diversified supply chain Legal vetting process
Mindset Problem as learning opportunity Adaptation over waiting Quality over speed
Long-term Impact Stronger security prevents future fraud More resilient operations Protected brand identity

Practical Lessons for Amazon Sellers

What can other sellers take from these experiences?

Verify everything financial. Before wiring money, confirm details through multiple channels. Phone calls, verified contacts, and secondary approvals prevent costly mistakes.

Build redundancy into operations. Single suppliers, single fulfillment methods, and single points of failure create vulnerability. Diversification costs more upfront but saves businesses during disruptions.

Invest in proper legal foundations. Trademark searches, brand registration, and compliance checks seem tedious until they prevent disasters. Numa Foods learned this the expensive way.

Communicate transparently with customers. When problems arise, honest updates build trust. Silence creates suspicion.

Document processes. Angela’s team now has written protocols for financial transactions. When challenges occur, documented procedures ensure consistency.

Want to Avoid the Same Mistakes Other Amazon Sellers Made?

Many successful Amazon sellers talk about the same turning points – learning how to manage ads properly, understanding their data, and adjusting campaigns based on real performance. Without that visibility, it is easy to waste budget or miss growth opportunities.

WisePPC is built to help sellers see what is actually happening inside their Amazon business. The platform connects with Seller Central and Amazon Ads accounts to track campaign performance, sales data, and inventory signals in one place, helping sellers make clearer decisions instead of guessing.

If you are building your own Amazon success story, WisePPC can help you:

  • analyze Amazon PPC campaigns and performance metrics
  • identify what drives sales and what wastes ad spend
  • manage campaigns and marketplace data from a single dashboard

The Broader Amazon Seller Landscape

These success stories reflect broader trends in e-commerce. According to the U.S. Small Business Administration, the U.S. ecommerce market brought in more than $504 billion in revenue in 2018, with projections to exceed $735 billion by 2023. The market keeps growing, but so does competition.

Many manufacturers don’t want to handle Amazon’s complex compliance and logistics rules. This creates opportunities for sellers who specialize in these areas. Geneva Supply, an SBA loan success story, built an entire business helping manufacturers sell through Amazon’s marketplace.

Founded in 2009, Geneva Supply provides logistics, packaging, and e-commerce marketing support. They used a $1.6 million SBA-backed loan in 2017 to purchase their building, leveraging the 25-year term and low fixed interest rate to maintain cash flow for growth.

But wait. Not everyone needs seven-figure loans. Many Amazon businesses start with minimal investment. The U.S. Small Business Administration notes that online store costs can run under $50 monthly for the selling platform, plus transaction fees and inventory.

Moving Forward as an Amazon Seller

The stories of Angela Stephens, Moisture Love, and Numa Foods demonstrate that challenges don’t determine success—responses do.

Every Amazon seller will face obstacles. Supply issues, financial problems, legal complications, or marketplace changes all happen eventually. The sellers who thrive build systems that handle these disruptions.

They verify financial transactions, diversify suppliers, protect their brands legally, and communicate honestly with customers. They treat setbacks as education rather than defeat.

Most importantly, they take action. Problems don’t solve themselves through hope or waiting. The three sellers profiled here acted decisively when challenges emerged.

That’s the real lesson: Amazon success comes from resilience, not perfection. Build strong foundations, expect challenges, and respond strategically when they arrive. The marketplace rewards sellers who persist through difficulties, adapt to changing conditions, and learn from every obstacle.

Ready to start or grow an Amazon business? Study these success stories, implement their lessons, and prepare for the inevitable challenges ahead. The path won’t be smooth, but with the right approach, obstacles become stepping stones rather than roadblocks.

Frequently Asked Questions

What’s the biggest challenge new Amazon sellers face?

Cash flow management tops the list. Between inventory costs, Amazon fees, and marketing expenses, sellers need sufficient capital to sustain operations before profits arrive. Many underestimate the time between investment and returns.

How can sellers protect themselves from phishing scams?

Implement multi-channel verification for all financial transactions. Confirm wire transfer details through phone calls to known contacts, never rely solely on email. Use two-factor authentication on all accounts and train staff to recognize phishing attempts.

Should Amazon sellers have backup suppliers?

Absolutely. Single-supplier dependence creates massive risk. Even reliable manufacturers face disruptions—natural disasters, equipment failures, or capacity issues. Having at least two qualified suppliers for critical products protects business continuity.

How long does trademark registration take for Amazon products?

The trademark registration process typically takes 12-18 months through the USPTO as of 2024-2026. Sellers should begin this process before product launch, not after. Conducting comprehensive trademark searches early prevents costly rebranding later.

What’s the best way to handle customer communication during disruptions?

Proactive transparency works best. Update product listings with realistic expectations. Send direct communications explaining delays or issues. Customers tolerate problems far better when kept informed rather than left wondering.

Do Amazon sellers need business insurance?

Product liability insurance protects against claims related to products sold. As businesses grow, additional coverage for property, cyber liability, and business interruption becomes important. Insurance costs less than the lawsuits or losses it prevents.

How much capital do sellers need to start on Amazon?

Initial investment varies widely based on product type and business model. Some sellers start with a few thousand dollars for inventory and fees. Others need substantially more for product development, branding, and marketing. Adequate cash reserves for 6-12 months of operations increase success odds.

How AWD Makes Your Supply Chain & FBA Work Better (2026)

Quick Summary: Amazon Warehousing and Distribution (AWD) provides low-cost bulk storage and automatic replenishment to FBA centers, helping sellers reduce storage fees by 30-80% during peak seasons. When combined strategically with FBA, AWD streamlines supply chains by storing excess inventory affordably while maintaining fast fulfillment through FBA’s network. Sellers benefit most by storing slow-moving or seasonal products in AWD while keeping fast movers in FBA for immediate order fulfillment.

Managing Amazon inventory has become increasingly complex for FBA sellers. Storage limits tighten during Q4. Fees spike when seasonal products sit too long. And balancing stock levels without running out—or hemorrhaging money on storage—feels like walking a tightrope.

That’s where Amazon Warehousing and Distribution enters the picture.

AWD offers sellers an upstream storage solution designed to work alongside FBA. Think of it as a holding area for bulk inventory that automatically feeds products into FBA centers when stock runs low. The promise? Lower storage costs, simplified replenishment, and better inventory control across your entire supply chain.

But does AWD actually deliver on these claims? And more importantly, how can sellers use both services together without creating new headaches?

Let‘s break down exactly how AWD functions, where it fits into your existing FBA strategy, and when it makes financial sense to split your inventory between both systems.

What Is Amazon Warehousing and Distribution?

Amazon Warehousing and Distribution is a bulk storage service that launched as an upstream solution for FBA sellers. Unlike FBA centers optimized for rapid order fulfillment, AWD facilities focus on long-term inventory storage at significantly reduced rates.

The core concept is straightforward. Sellers send large shipments from manufacturers or third-party warehouses directly to AWD facilities. Amazon stores these products in bulk. Then, based on settings configured by the seller, AWD automatically replenishes FBA centers as inventory depletes.

No enrollment process is required to start using AWD. Sellers can simply create a shipment plan through Seller Central and designate AWD as the destination. This differs from FBA, which requires formal enrollment before sending the first shipment.

AWD serves as a buffer between your supplier and Amazon’s fulfillment network. Products move from manufacturer to AWD to FBA to customer. This staged approach prevents overstocking FBA centers while maintaining healthy inventory levels for order fulfillment.

How AWD Differs From Traditional FBA

The distinction between AWD and FBA comes down to purpose and optimization. FBA centers handle customer orders. AWD facilities manage inventory storage and distribution.

Feature AWD FBA
Primary purpose Long-term bulk storage and inventory management Direct-to-customer order fulfillment
Enrollment process No enrollment needed Requires enrollment
Storage optimization Bulk storage, pallets, larger quantities Unit-level storage, fast picking
Replenishment Automatic transfer to FBA Manual shipments from external sources
Storage duration Designed for extended storage Optimized for rapid turnover
Fee structure Lower per cubic foot rates Higher rates, seasonal increases


Inventory stored in AWD and FBA occupies different parts of Amazon’s logistics network. AWD facilities use warehouse space optimized for bulk pallets and extended storage periods. FBA centers prioritize accessibility and speed, storing products in locations that enable same-day or next-day delivery.

This fundamental difference in design explains why AWD costs less. The facilities don’t need the same level of automation, geographic distribution, or rapid access infrastructure that FBA requires.

Why Sellers Are Adding AWD to Their FBA Strategy

The value proposition for AWD centers on three main benefits: cost reduction, operational simplification, and inventory flexibility. Each addresses specific pain points that FBA sellers commonly face.

Substantial Storage Cost Savings

Storage fees represent one of the largest ongoing expenses for FBA sellers, especially those carrying seasonal products or large inventories. AWD’s rates run significantly lower than standard FBA storage.

For standard-size items, savings can range from 30% to 80% depending on the season. The gap widens dramatically during Q4, when FBA implements peak storage surcharges but AWD rates remain consistent.

Here’s the math that matters. AWD storage costs approximately $0.48 per cubic foot monthly. Standard FBA storage runs $0.87 per cubic foot for the same period. That $0.39 difference per cubic foot compounds quickly across large inventories.

Consider a seller storing 1,000 cubic feet of inventory. In AWD, monthly storage runs $480. The same inventory in FBA costs $870. Over twelve months, that’s $4,680 in savings just from choosing AWD for bulk storage.

The savings become even more pronounced during October through December, when FBA adds peak storage fees. During these months, FBA rates can climb significantly while AWD maintains standard pricing.

Automatic Replenishment Eliminates Manual Work

Managing FBA inventory traditionally requires constant monitoring. Sellers check stock levels, forecast demand, create shipment plans, coordinate with suppliers, and track inbound inventory. It’s time-consuming and prone to human error.

AWD’s automatic replenishment removes most of these manual steps. Sellers configure minimum and maximum stock thresholds for each product. When FBA inventory drops below the minimum, AWD automatically creates a replenishment shipment.

The system handles transfer logistics internally. Products move from AWD facilities to the appropriate FBA centers without seller intervention. No shipment plans to create. No carrier coordination. No tracking multiple inbound shipments.

For products with multiple seller SKUs under the same ASIN, Amazon uses the highest value set across all SKUs to determine replenishment quantity. Updates to these settings can take up to 24 hours to take effect.

This automation particularly benefits sellers managing large catalogs. Instead of monitoring dozens or hundreds of SKUs individually, the replenishment system maintains target stock levels across the entire inventory.

One Inventory Pool for Multi-Channel Distribution

Many sellers operate beyond just Amazon. They might have Shopify stores, wholesale accounts, or other sales channels. Traditional FBA inventory can only fulfill Amazon orders, creating fragmentation across different warehouses and systems.

AWD offers multi-channel distribution capabilities. Inventory stored in AWD facilities can feed FBA for Amazon orders while also supporting shipments to other channels. This creates a single inventory pool rather than splitting stock across multiple locations.

The unified approach reduces total inventory requirements. Instead of maintaining separate stock for Amazon and other channels, sellers can draw from one larger pool. This improves inventory turnover and reduces the risk of stock imbalances where one channel is overstocked while another runs dry.

How AWD integrates with FBA and other sales channels to create a unified inventory system with automatic replenishment.

Strategic Implementation: When to Use AWD vs FBA

The real question isn’t whether AWD or FBA is better. It’s which products belong in each system and how to optimize the split.

Not every product makes sense for AWD. Fast-moving items with high daily sales velocity need the immediacy of FBA. But slow movers, seasonal products, and bulk overstock? Those are prime candidates for AWD storage.

Products That Belong in AWD

Seasonal inventory represents the clearest use case. Products that sell heavily during specific periods but sit idle the rest of the year incur massive storage fees in FBA. Moving these items to AWD during off-seasons cuts costs dramatically while maintaining availability for replenishment when demand returns.

Slow-moving products with consistent but low sales velocity also benefit from AWD placement. These items tie up expensive FBA space without generating enough velocity to justify the premium storage costs. AWD provides a cost-effective holding area while automatic replenishment ensures FBA never runs dry.

New product launches with uncertain demand create another opportunity. Instead of sending large quantities directly to FBA and risking long-term storage fees, sellers can stage inventory in AWD. Small initial quantities go to FBA for testing. If the product performs well, AWD automatically feeds additional units into the fulfillment network.

Bulk overstock from manufacturer minimum order quantities fits naturally into AWD. Many suppliers require minimum purchases that exceed short-term FBA needs. Sending everything to FBA invites high storage fees. Routing the excess to AWD while keeping active inventory in FBA balances cost and availability.

Products That Should Stay in FBA

High-velocity products need to remain in FBA. These items sell rapidly enough that storage costs become negligible compared to sales revenue. The faster turnover and direct fulfillment path justify FBA’s higher storage rates.

Products with unpredictable demand spikes also work better in FBA. If sales can suddenly triple due to external factors, having inventory already positioned in fulfillment centers prevents stockouts. The automatic replenishment from AWD introduces a delay—typically 2-3 days at minimum—that can miss unexpected demand surges.

Community discussions highlight concerns about AWD replenishment timing. Real data from October 2025 showed AWD averaging 7.1 days for check-in compared to 4.7 days for standard FBA direct shipments. That 2.4-day difference matters for fast-moving inventory. Reports indicate AWD transfer times can vary significantly by fulfillment center and conditions.

Small, lightweight products with minimal storage footprint might not benefit enough from AWD to justify the added complexity. If FBA storage fees are already negligible, splitting inventory between two systems adds operational overhead without meaningful cost savings.

Strategic framework for determining which products to store in AWD versus FBA based on sales characteristics and business priorities.

Configuring Automatic Replenishment Settings

The effectiveness of AWD depends heavily on proper replenishment configuration. Set thresholds too high and inventory flows to FBA unnecessarily, negating storage savings. Set them too low and stockouts become a constant threat.

Minimum threshold represents the trigger point. When FBA inventory drops to this level, AWD initiates a replenishment shipment. Setting this requires understanding lead time—how many days between AWD shipment creation and FBA availability.

Based on community discussions, AWD to FBA transfer times can average 7 days or more, with reports of delays extending to 14+ days during peak periods. Conservative minimum thresholds should account for this variability plus a safety buffer.

Maximum threshold determines how much inventory FBA should hold at peak. This prevents over-replenishment that would recreate the storage cost problem AWD is meant to solve. The maximum should cover peak daily sales multiplied by the replenishment cycle time.

Regular monitoring and adjustment of these settings becomes crucial. Seasonal demand shifts, promotional periods, and trending products all require threshold updates to maintain optimal performance.

Need Better Results From AWD and FBA? Start With the Ads

Improving your supply chain with Amazon AWD and FBA can help products move faster and stay in stock – but inventory alone does not drive sales. Once products are available in Amazon’s network, performance often depends on how well your advertising is managed.

WisePPC focuses specifically on Amazon advertising and marketplace growth. Their team works with brands to manage Sponsored Ads, improve campaign structure, and connect advertising data with listing and inventory performance.

If you are investing in AWD and FBA to scale your Amazon operations, WisePPC can help you:

  • manage and optimize Amazon PPC campaigns
  • improve visibility for stocked products
  • align advertising strategy with inventory and fulfillment

The Real Costs: AWD vs FBA Storage Breakdown

Understanding the true cost difference requires looking beyond simple per-cubic-foot rates. Transfer fees, processing times, and operational overhead all factor into the total equation.

AWD storage runs approximately $0.48 per cubic foot monthly for standard-size items. FBA standard storage sits at $0.87 per cubic foot outside peak season. During October through December, FBA rates climb higher while AWD maintains consistent pricing.

But storage represents only one component. AWD to FBA transfers include processing and transportation fees. These costs vary based on distance between facilities and shipment size but typically add $0.10 to $0.30 per unit for standard items.

The transfer fees can erode savings for products with high turnover. If inventory cycles through AWD to FBA multiple times per quarter, the cumulative transfer costs might exceed the storage savings.

Real value emerges with products that sit in AWD for extended periods—60, 90, or 120+ days—before requiring replenishment. The longer storage duration amplifies the monthly savings while transfer fees remain fixed per cycle.

Hidden Costs and Considerations

Replenishment delays create an indirect cost through potential lost sales. User experiences shared in seller communities highlight situations where AWD transfers took 10-14 days during peak periods, causing temporary stockouts despite adequate total inventory.

The opportunity cost of stockouts can exceed storage savings. Extended delays create lost sales during critical periods that may outweigh monthly storage cost reductions.

Reduced control and visibility represent another less tangible cost. FBA shipments provide detailed tracking and predictable check-in times. AWD transfers operate more like a black box—inventory leaves AWD and eventually appears in FBA, but interim visibility remains limited.

This opacity complicates inventory planning and makes it harder to diagnose issues when problems occur. Sellers accustomed to tight control over every shipment may find the reduced transparency frustrating.

Practical Implementation: Sending Your First AWD Shipment

Getting started with AWD requires no special enrollment or application. Sellers with active FBA accounts can create AWD shipments immediately through Seller Central.

The process begins in the inventory management section. Select products to send to AWD and specify quantities. Amazon generates a shipment plan with the designated AWD facility as the destination.

Pack products following standard FBA prep requirements. AWD facilities accept the same packaging specifications as FBA centers. Label boxes with the provided shipment IDs and carrier labels.

Ship using Amazon’s partnered carriers or approved third-party carriers. Tracking information uploads automatically to Seller Central, allowing monitoring of inbound progress.

Once AWD receives and checks in the inventory, products become available for automatic replenishment or manual transfer to FBA. The check-in process typically completes within 3-5 business days for standard shipments.

Setting Up Automatic Replenishment

After inventory arrives at AWD, configure replenishment settings for each SKU. Navigate to the AWD inventory management dashboard and select the products to set up.

Enter minimum and maximum FBA quantities based on sales velocity and desired reorder cycle. Conservative settings prioritize stock availability while aggressive settings maximize storage savings.

Enable automatic replenishment and save the configuration. The system begins monitoring FBA levels immediately and will initiate transfers when thresholds trigger.

Monitor performance during the first few replenishment cycles. Adjust thresholds if stockouts occur or if FBA inventory consistently exceeds maximum targets.

Common Challenges Sellers Face With AWD

AWD isn’t without drawbacks. Several recurring issues emerge from community discussions and user experiences.

Longer and Less Predictable Check-In Times

The most frequently cited complaint involves transfer delays. While FBA direct shipments typically check in within 3-5 days, AWD replenishments average 7 days and can extend significantly longer.

Transfer times vary significantly by fulfillment center location and conditions, with some reports indicating delays of 10-14 days during peak periods compared to 2-5 days for direct FBA shipments.

This unpredictability complicates inventory planning. Sellers can’t reliably predict when replenishments will become available, making it harder to maintain optimal stock levels during high-velocity periods.

Limited Visibility During Transfers

Once inventory ships from AWD to FBA, detailed tracking information becomes sparse. Sellers see that a transfer initiated and eventually that products arrived, but the interim status remains opaque.

This limited visibility creates anxiety during critical periods. Is the shipment delayed? Lost? Sitting in a receiving queue? The lack of detailed status updates makes it difficult to answer these questions or take corrective action.

Minimum Shipment Requirements

AWD works best for bulk storage, and the service reflects this in its requirements. Minimum shipment sizes and quantity restrictions mean not every product qualifies for practical AWD use.

Small test quantities or low-volume SKUs may not meet minimum thresholds, forcing these products to use standard FBA exclusively. This creates operational complexity for sellers with diverse catalogs mixing high and low volume items.

Optimizing Your Mixed AWD and FBA Strategy

The most successful implementations don’t treat AWD and FBA as either-or choices. Instead, they strategically split inventory based on product characteristics and business objectives.

Start by analyzing existing inventory performance. Identify products with low turnover rates, high storage costs relative to sales, or significant seasonal variation. These become the initial AWD candidates.

Keep fast movers and products with unpredictable demand spikes in FBA exclusively. The immediate availability and faster replenishment cycles justify the higher storage costs for these items.

For products sitting in the middle—moderate velocity, predictable demand, significant storage footprint—test AWD with a portion of inventory. Keep a base quantity in FBA while storing excess in AWD. Monitor performance over 30-60 days and adjust based on results.

Track key metrics for AWD products: replenishment frequency, transfer times, stockout incidents, total storage costs, and sales velocity changes. This data drives ongoing optimization and helps identify which products benefit most from the AWD approach.

Seasonal adjustments become particularly important. Pre-load AWD with inventory several months before peak season, allowing time for gradual replenishment to FBA as demand builds. This spreads the transfer timing risk across multiple cycles rather than relying on a single large replenishment during the crucial sales period.


Frequently Asked Questions

What products are eligible for Amazon Warehousing and Distribution?

Most standard FBA-eligible products can use AWD, including standard-size and oversize items. Products must meet FBA prep requirements and cannot include restricted or hazardous materials. Items already enrolled in FBA qualify automatically without additional enrollment for AWD.

How much cheaper is AWD storage compared to FBA?

Effective January 15, 2026, AWD storage in the West Region is $0.57/cu ft (other regions $0.48). Base transportation fees are $1.40/cu ft ($1.26 for Amazon Managed), and processing fees are $1.40 per box.

How long does AWD to FBA replenishment take?

Average transfer times run 5-7 days under normal conditions but can extend to 14+ days during peak periods or for certain fulfillment center destinations. Real data from October 2025 showed AWD averaging 7.1 days compared to 4.7 days for direct FBA shipments. Sellers should factor this longer and more variable timeline into replenishment threshold settings.

Can AWD inventory fulfill orders from other sales channels besides Amazon?

Yes, AWD supports multi-channel distribution. Inventory stored in AWD facilities can be directed to FBA for Amazon orders or shipped directly to other channels including Shopify stores, wholesale accounts, or third-party marketplaces. This creates a unified inventory pool serving multiple sales channels from a single storage location.

What happens if AWD runs out of inventory before replenishing FBA?

If AWD depletes before automatic replenishment triggers or completes, FBA inventory will eventually sell down to zero, creating a stockout. AWD cannot replenish what it doesn’t have. Sellers must monitor total inventory across both systems and send new shipments to AWD before complete depletion to maintain continuous availability.

Does using AWD affect my FBA storage limits?

Inventory in AWD does not count against FBA storage limits. Only products physically stored in FBA centers apply to capacity restrictions. This allows sellers to maintain large total inventory positions while staying within FBA capacity constraints by keeping excess stock in AWD and only transferring what FBA limits permit.

Can I manually control when AWD sends inventory to FBA instead of using automatic replenishment?

Yes, sellers can choose manual or automatic replenishment. Manual mode requires creating transfer requests through Seller Central each time FBA needs additional inventory. Automatic mode handles transfers based on configured minimum and maximum thresholds. Many sellers use automatic replenishment for predictable products and manual control for items with variable or seasonal demand patterns.


Final Thoughts: Making AWD and FBA Work Together

AWD represents a valuable tool for sellers struggling with storage costs, inventory limits, or seasonal demand fluctuations. The cost savings are real—30-80% reductions in storage fees add up quickly for products sitting in inventory for months.

But AWD isn’t a universal solution. The longer transfer times, reduced visibility, and operational complexity mean it works better for some inventory profiles than others. Fast-moving products, trending items, and anything with unpredictable demand typically performs better staying in FBA exclusively.

The sweet spot? Seasonal products, slow movers with consistent demand, bulk overstock, and new product launches with uncertain velocity. These inventory types benefit from AWD’s low-cost storage while automatic replenishment maintains availability in FBA for order fulfillment.

Successful implementation requires thoughtful product selection, conservative replenishment thresholds, and ongoing monitoring. Start with a subset of inventory—10-20% of total SKUs that clearly fit the ideal profile. Learn how AWD performs for your specific business before committing large portions of inventory.

Track the metrics that matter: total storage costs, transfer frequency, stockout incidents, and sales velocity. If storage savings exceed the cost of occasional stockouts and the operational overhead feels manageable, gradually expand AWD usage to additional products.

The question isn’t whether AWD or FBA is better. It’s how to use both strategically to minimize costs while maintaining the inventory availability that drives sales. Get the split right, and the combination delivers lower overhead without sacrificing customer experience.

Ready to optimize your Amazon inventory strategy? Start by analyzing your current storage costs and identifying products spending 60+ days in FBA. Those are your first AWD candidates. Configure conservative replenishment settings and monitor performance for 30 days. Adjust based on results and expand gradually.

The sellers winning with AWD aren’t the ones going all-in. They’re the ones strategically splitting inventory based on data, not hope. Run the numbers for your specific products. The math will tell you exactly where AWD makes sense and where it doesn’t.

How to Reduce ACOS and Improve ROAS: Data-Driven Strategies for Amazon Sellers

Introduction

ACOS—Advertising Cost of Sale—is the metric that keeps Amazon sellers awake at night. It’s the clearest signal of whether your ad spend generates profit or burns cash. When ACOS climbs above your margin, every sale costs more than it earns. When it drops below target, you’ve found the holy grail of scalable, profitable advertising.

But here’s the uncomfortable truth: most Amazon advertisers don’t truly understand their ACOS. They see the headline number in Campaign Manager, make reactive bid adjustments, and hope for improvement. They miss the structural drivers of high ACOS. They ignore the relationship between ACOS and ROAS (Return on Ad Spend). They fail to account for product lifecycle, competitive dynamics, and customer acquisition value.

This guide changes that. We’ll dissect ACOS from every angle—what drives it, how to diagnose problems, and most importantly, systematic strategies to reduce it while maintaining (or growing) sales volume. These aren’t theoretical concepts; they’re battle-tested approaches from accounts managing millions in monthly ad spend.

Whether you’re struggling with 100%+ ACOS bleeding money, or optimizing a profitable 15% ACOS for even better returns, you’ll find actionable tactics here.


Understanding ACOS: Beyond the Headline Number

The ACOS Formula

ACOS = (Ad Spend / Ad Revenue) × 100

Simple enough. Spend $100, generate $500 in sales, ACOS is 20%. But this simplicity masks enormous complexity. The headline ACOS in Campaign Manager aggregates diverse performance across:

  • Multiple campaigns with different objectives
  • Keywords at various stages of optimization
  • Products with different margin profiles
  • Customer segments with varying lifetime value
  • Time periods with seasonal fluctuations

Treating this as a single number is like diagnosing a patient’s health from their weight alone. You need to unpack the components.

ACOS vs. ROAS: Two Sides of the Same Coin

ROAS = Ad Revenue / Ad Spend

ACOS and ROAS measure the same relationship inverted:

  • 20% ACOS = 5.0 ROAS
  • 50% ACOS = 2.0 ROAS
  • 10% ACOS = 10.0 ROAS

Different contexts favor different metrics:

  • ACOS is intuitive for margin-based thinking (“I have 30% margin, so 25% ACOS is profitable”)
  • ROAS is intuitive for return-based thinking (“Every $1 spent returns $4 in revenue”)

Use whichever aligns with your mental model, but understand both. Some optimization decisions are clearer through one lens than the other.

Break-Even ACOS: Your North Star

Before optimizing ACOS, you must know your break-even point:

Break-Even ACOS = Profit Margin Before Ads

Calculate this for each product:

  1. Selling Price: $50
  2. Amazon Fees (15% referral + FBA): $18
  3. Cost of Goods Sold: $15
  4. Other Costs (returns, storage): $2
  5. Profit Margin: $15 (30%)

Your break-even ACOS is 30%. Spend more, you lose money on every ad-attributed sale. Spend less, advertising generates incremental profit.

Critical Insight: Break-even ACOS varies dramatically by product. A premium item with 45% margin can sustain 40% ACOS and still profit. A thin-margin product at 15% margin must achieve sub-15% ACOS or advertising destroys profitability.

Never optimize to a single account-wide ACOS target. Set product-specific targets based on margin and strategic objectives.

The ACOS Spectrum: From Bleeding to Scaling

Different ACOS levels indicate different situations:

ACOS > 100%: Losing money on every sale. Immediate intervention required. Check for:

  • Incorrect bids (bidding $5 on a $10 product)
  • Irrelevant keyword targeting
  • Technical tracking issues
  • New campaigns in learning phase

ACOS 50-100%: Marginally unprofitable or break-even. Common for:

  • Competitive keywords in early optimization
  • Brand awareness campaigns
  • New product launches building sales velocity
  • High-intent, low-margin categories

ACOS 25-50%: Moderately profitable for most categories. Typical for:

  • Mature campaigns with ongoing optimization
  • Competitive markets with reasonable margins
  • Mixed portfolio of proven and experimental targeting

ACOS 10-25%: Strong profitability. Usually indicates:

  • Brand keyword campaigns (highest intent, lowest competition)
  • Long-tail keyword focus
  • Defensive advertising on owned ASINs
  • High-margin products with limited competition

ACOS < 10%: Exceptional performance. Possible scenarios:

  • Brand defense campaigns
  • Retargeting to past purchasers
  • Product with strong organic rank amplifying ad efficiency
  • Underinvestment (could scale volume profitably)


Diagnosing High ACOS: Root Cause Analysis

Before fixing ACOS, diagnose why it’s high. Different problems require different solutions.

Diagnostic Framework: The ACOS Tree

Start with the headline number, then drill down:

Account-Level ACOS → By Campaign Type (Sponsored Products vs. Brands vs. Display) → By Campaign Objective (Brand Defense vs. Conquesting vs. Awareness) → By Product/Margin Profile → By Keyword Category (Brand vs. Category vs. Competitor) → By Match Type (Exact vs. Phrase vs. Broad) → By Placement (Top of Search vs. Product Pages vs. Rest of Search)

Each branch reveals different optimization opportunities.

Common High ACOS Causes

  1. Bid Inflation

Symptoms: High CPCs, competitive keywords, auction pressure

Root causes:

  • Bidding wars with aggressive competitors
  • Automatic campaign overbidding
  • New entrants with high bids and low quality scores
  • Seasonal competition (Q4, Prime Day)

Solution approach: Strategic bid management, not blanket reductions

  1. Poor Keyword Relevance

Symptoms: Low CTR (<0.3%), high bounce rate, few conversions

Root causes:

  • Broad match bleeding on irrelevant queries
  • Missing negative keywords
  • Keyword-product mismatch
  • Search terms not matching customer intent

Solution approach: Tighter targeting, extensive negatives

  1. Weak Conversion Rate

Symptoms: Good CTR, many clicks, few sales

Root causes:

  • Listing quality issues (images, bullets, reviews)
  • Price uncompetitive
  • Poor inventory (out of stock, slow shipping)
  • Weak product-market fit

Solution approach: Fix the listing before the ads

  1. Wrong Campaign Structure

Symptoms: Uneven performance within campaigns, conflicting metrics

Root causes:

  • Too many keywords per ad group
  • Mixed intent in same campaign
  • No segmentation by margin or objective
  • Inherited legacy structure

Solution approach: Restructure for control and clarity

  1. Inappropriate Targets

Symptoms: High spend, low conversion, unrelated search terms

Root causes:

  • Automatic campaigns without proper negatives
  • ASIN targeting on irrelevant products
  • Broad match without monitoring
  • Competitor conquesting on mismatched offerings

Solution approach: Surgical targeting refinement


Strategy 1: Precision Bid Management

Bid management is the most direct ACOS lever. These approaches reduce wasteful spend while preserving volume.

The Bid-ACOS Relationship

Mathematically, ACOS = (CPC × Clicks) / (CVR × Clicks × Price) = CPC / (CVR × Price)

Your ACOS is directly proportional to CPC and inversely proportional to conversion rate and price. To reduce ACOS:

  • Lower CPC (reduce bids)
  • Increase CVR (improve listing/offers)
  • Focus on higher-priced variants

Bid adjustments are immediate; conversion optimization takes time. Start with bids for quick wins.

Bid Reduction Strategies

The Gradual Descent

Never slash bids 50% hoping to halve ACOS. You’ll kill volume and destroy campaign history. Instead:

Week 1: Reduce bids 15% on high-ACOS keywords Week 2: Evaluate impact—if ACOS improved and volume acceptable, reduce another 10% Week 3: Find the floor where ACOS targets meet minimum volume thresholds

The Position Targeting Approach

Different positions have different ACOS profiles:

  • Position 1 (Top of Search): Highest visibility, often highest ACOS due to competitive bidding
  • Position 2-3: Sweet spot for many keywords—good visibility, better efficiency
  • Position 4-6: Lower volume, potentially better ACOS for long-tail terms

Use placement reports to identify where your ACOS is highest. Reduce Top of Search multipliers if that placement drives poor efficiency.

The Portfolio Rebalancing

Not all keywords deserve the same bid approach:

  • Defensive Brand Keywords: Lower bids to maintain position 1-2 at efficient ACOS
  • Category Keywords: Aggressive bids only on proven converters; test new ones conservatively
  • Competitor Keywords: High bids rarely sustainable; focus on where you win
  • Long-Tail Keywords: Often underbid—these can scale profitably with higher bids

Dynamic Bid Rules

Set up systematic bid adjustments based on performance signals:

Rule Set: Weekly Optimization


Metric Threshold Action
ACOS > 2× target Reduce bid 20%
ACOS 1.5-2× target Reduce bid 10%
ACOS 1.0-1.5× target Reduce bid 5%
ACOS 0.5-1.0× target Maintain bid
ACOS < 0.5× target Increase bid 15%
Spend > $50, Orders = 0 Pause keyword


Apply these rules weekly across your account for systematic ACOS improvement.

Bid Caps and Floors

Prevent extreme bids that destroy ACOS:

Maximum Bid Formula: Max Bid = Target ACOS × Product Price × Expected CVR

Example: 25% target ACOS, $40 product, 10% expected CVR Max Bid = 0.25 × $40 × 0.10 = $1.00

Never bid above this ceiling regardless of competition.

Minimum Bid Consideration: Too-low bids lose volume and learning data. Generally, maintain bids that generate at least 10 clicks per week per keyword.


Strategy 2: Surgical Keyword Optimization

Keywords are where intent meets your product. Precision here dramatically impacts ACOS.

The Keyword Performance Matrix

Segment keywords by volume and efficiency:

High Volume, Low ACOS (Stars):

  • Action: Protect and expand
  • Increase bids moderately to capture more volume
  • Add as exact match negatives to broader campaigns to prevent cannibalization
  • Monitor closely for competitive pressure

High Volume, High ACOS (Problem Children):

  • Action: Optimize or eliminate
  • Reduce bids aggressively if conversion possible
  • Add negative if fundamentally mismatched
  • Check search term alignment

Low Volume, Low ACOS (Hidden Gems):

  • Action: Scale
  • Increase bids to test volume potential
  • Expand match type or add variations
  • Often underinvested opportunities

Low Volume, High ACOS (Dogs):

  • Action: Pause
  • Minimal impact but drag down account
  • Free up budget for better performers

Match Type Strategy

Different match types have different ACOS profiles:

Exact Match: Highest control, typically best ACOS

  • Use for proven keywords with sufficient volume
  • Highest bids justified by performance certainty

Phrase Match: Moderate expansion, monitor ACOS closely

  • Broader than exact but still targeted
  • Higher volume potential with some quality loss

Broad Match: Maximum reach, often ACOS killer

  • Only use with extensive negative keyword lists
  • Best for discovery, not core performance
  • Consider broad match modifiers or phrase instead

Recommended Structure:

  • 70% budget in exact match (proven performers)
  • 20% budget in phrase match (controlled expansion)
  • 10% budget in broad match (discovery only, heavy negatives)

Negative Keyword Discipline

The fastest way to improve ACOS is stopping spend on irrelevant traffic.

Weekly Negative Keyword Workflow:

  1. Pull Search Term Report (last 30 days)
  2. Filter: Spend > $15, Orders = 0
  3. Review each term—would a customer searching this buy your product?
  4. Add obvious mismatches as negative exact match
  5. Add broader irrelevant themes as negative phrase match

The 30-Day Rule: Any search term with 30+ clicks and zero conversions is a negative keyword candidate. No exceptions.

Preemptive Negatives:

Maintain lists of universally irrelevant terms:

  • Free, giveaway, sample, trial
  • DIY, homemade, how to make, build
  • Cheap, discount, wholesale, bulk
  • Jobs, careers, employment, hiring
  • Competitor brand names you don’t want to conquest

Apply these to new campaigns before launch.

Keyword Expansion vs. ACOS

Growing keywords can temporarily spike ACOS. New keywords go through phases:

Phase 1: Learning (Weeks 1-2)

  • High ACOS as algorithm tests placement
  • Limited data for optimization
  • Accept higher ACOS temporarily

Phase 2: Optimization (Weeks 3-6)

  • Performance stabilizes
  • Apply bid adjustments based on emerging data
  • Prune or scale based on early signals

Phase 3: Maturity (Week 6+)

  • Stable, predictable performance
  • ACOS reaches steady state
  • Optimize incrementally

Budget for learning phase ACOS. Don’t kill promising keywords too early, but set spend limits (e.g., $50 without conversion = pause).


Strategy 3: Campaign Structure for ACOS Control

Structure determines how precisely you can optimize. Poor structure forces averaged decisions; good structure enables surgical precision.

The Single Keyword Ad Group (SKAG) Approach

Traditional structure: Multiple keywords per ad group SKAG structure: One keyword per ad group

Advantages for ACOS:

  • Bid at keyword level, not ad group average
  • Search term mapping is clear
  • Quality Score optimization per keyword
  • Negative keyword control at keyword level

Trade-off: More management overhead. Use bulk tools to handle scale.

Margin-Based Campaign Segmentation

Group products by margin profile:

High-Margin Campaigns (40%+ margin):

  • Target ACOS: 30-35% (profitable with volume)
  • Aggressive bidding on proven keywords
  • Higher appetite for testing

Medium-Margin Campaigns (20-40% margin):

  • Target ACOS: 15-25%
  • Balanced approach to growth and efficiency
  • Careful keyword selection

Low-Margin Campaigns (<20% margin):

  • Target ACOS: <15%
  • Defensive strategy—brand protection, proven keywords only
  • Minimal testing, maximum efficiency

Never average these together. Averaging forces suboptimal decisions on both high and low margin products.

Objective-Based Structure

Separate campaigns by goal, each with appropriate ACOS tolerance:

Profit Campaigns: Direct sales, strict ACOS targets Growth Campaigns: New products, review generation, accept higher ACOS temporarily
Defense Campaigns: Brand protection, maintain presence regardless of ACOS Research Campaigns: Testing, learning, limited budgets

Report and optimize each separately. Don’t let research campaigns poison profit campaign metrics.

Portfolio-Level ACOS Management

At scale, manage ACOS across portfolio, not individual keywords:

The Portfolio Rule: Some keywords will have high ACOS. That’s okay if they serve strategic purposes (new customer acquisition, competitor conquesting, awareness). Maintain portfolio-level ACOS below target while allowing individual variation.

Structure to enable this:

  • Label campaigns by objective
  • Set different ACOS targets by label
  • Report aggregate ACOS by label group
  • Make optimization decisions within context


Strategy 4: Placement and Timing Optimization

When and where ads appear affects ACOS as much as what they target.

Placement Performance Analysis

Amazon offers three placement types:

Top of Search (First Page): Premium position, often premium CPC

  • Check placement report: is ACOS here sustainable?
  • Adjust placement multipliers based on performance
  • Sometimes lowering Top of Search bids improves overall ACOS significantly

Product Pages: Competitor ASIN targeting, related products

  • Often different ACOS profile than search
  • May convert better for certain product categories
  • Adjust placement modifiers separately from search bids

Rest of Search: Lower positions on first page and subsequent pages

  • Usually lower CPC, variable conversion
  • Balance volume vs. efficiency

The Placement Modifier Formula:

If Top of Search ACOS is 40% vs. 20% Rest of Search, and your target is 25%:

  • Current Top of Search multiplier: 100%
  • Reduce to 50% to align ACOS closer to target
  • Test and iterate

Dayparting for ACOS Control

Performance varies by time of day:

Analysis Approach:

  1. Pull placement/time reports
  2. Calculate ACOS by hour
  3. Identify patterns (often: business hours = competitive = higher ACOS)

Common Patterns:

  • Early morning (5-8 AM): Lower competition, sometimes better ACOS
  • Business hours (9 AM-5 PM): Peak competition, often higher ACOS
  • Evening (7-10 PM): High intent, variable ACOS
  • Late night (11 PM-4 AM): Low volume, unpredictable ACOS

Dayparting Strategy: Reduce bids 20-30% during consistently high-ACOS hours. Increase during efficient hours. This is advanced optimization—ensure you have sufficient data before implementing.


Strategy 5: Conversion Rate Optimization

ACOS depends on conversion rate. Improve CVR, and the same bids produce better ACOS.

The CVR-ACOS Relationship

Double your conversion rate, halve your ACOS (assuming constant CPC).

Before: 5% CVR, $1 CPC, $40 product ACOS = $1 / (0.05 × $40) = 50%

After: 10% CVR, $1 CPC, $40 product
ACOS = $1 / (0.10 × $40) = 25%

Conversion optimization is ACOS optimization.

Listing Quality Impact on ACOS

Before adjusting bids on high-ACOS keywords, audit your listing:

Images:

  • Main image drives CTR
  • Lifestyle images drive conversion
  • Infographics communicate value
  • Video increases engagemen

Test: Pause a high-ACOS keyword, improve listing, relaunch. Often ACOS improves without bid changes.

Pricing:

  • Check competitor pricing
  • Consider promotional pricing for new products
  • Bundle strategy for value perception

Reviews:

  • Products with <10 reviews struggle to convert
  • Consider Vine program for new launches
  • Address negative feedback patterns

Content:

  • Bullet points should answer customer questions
  • A+ Content increases conversion 5-15%
  • Brand Story builds trust

Inventory and Fulfillment Impact

Out-of-stock products waste ad spend. Slow shipping reduces conversion.

Inventory-Based Rules:

  • < 30 days inventory: Reduce bids 40%
  • Out of stock: Pause campaigns immediately
  • Overstock: Increase bids to drive velocity

WisePPC’s inventory integration automates this, preventing ACOS damage from fulfillment issues.


Strategy 6: Product-Level ACOS Management

Different products have different ACOS potential. Manage accordingly.

Hero Product Strategy

Your top sellers deserve special treatment:

  • Accept higher ACOS for volume leaders (builds organic rank)
  • Protect ASINs with proven performance
  • Test aggressively to find scaling opportunities

ACOS on hero products is an investment in organic visibility, not just direct profit.

Long-Tail Product Efficiency

Low-volume products often achieve better ACOS with less competition:

  • Target specific, long-tail keywords
  • Lower bids sufficient for niche terms
  • Aggregate many small wins for portfolio impact

New Product Launch ACOS

New products start with zero reviews and no organic rank. Expect high ACOS initially:

Phase 1 (Weeks 1-4): Launch and review generation

  • Target ACOS: Break-even or slightly above
  • Goal: Sales velocity and initial reviews
  • Aggressive bidding to generate data

Phase 2 (Weeks 5-12): Optimization

  • Target ACOS: Gradual reduction to profitable level
  • Prune poor performers, scale winners
  • Build toward target ACOS

Phase 3 (Month 3+): Profitability

  • Target ACOS: Margin-appropriate level
  • Maintain with ongoing optimization
  • Scale volume within ACOS constraints

Don’t kill new products in Phase 1. Set appropriate expectations and timelines.


Measuring and Reporting ACOS Progress

The ACOS Dashboard

Track these metrics weekly:

Overall ACOS: Portfolio aggregate ACOS by Product Category: Identify problem areas ACOS by Campaign Type: SP vs. SB vs. SD performance ACOS Trend: 7-day, 30-day, 90-day moving averages ACOS vs. Target: Gap analysis by segment

Granular Reporting with WisePPC

WisePPC enables multi-dimensional ACOS analysis impossible in native Amazon:

Cross-Dimension Analysis:

  • ACOS by keyword × placement
  • ACOS by time × campaign type
  • ACOS by product × match type

Historical Tracking:

  • ACOS trends over any time period
  • Impact of specific optimization actions
  • Seasonal ACOS patterns

Automated Alerts:

  • ACOS spikes above threshold
  • Keywords exceeding spend without conversion
  • Campaigns deviating from target

This granularity reveals ACOS drivers invisible in aggregated reporting.


Common ACOS Mistakes to Avoid

Mistake 1: Chasing Low ACOS at All Costs

A 5% ACOS sounds great. But if it’s on $100/month spend, who cares? Volume matters. Sometimes 25% ACOS on $10,000/month generates more profit than 10% on $1,000.

Rule: Optimize for profit, not ACOS percentage.

Mistake 2: Ignoring Customer Lifetime Value

First-order ACOS ignores repeat purchases. A 50% ACOS on a customer who buys 3 more times at 0% ACOS (organic) is actually excellent.

Solution: Track blended ACOS including organic attribution for repeat customers.

Mistake 3: Comparing ACOS Across Categories

Beauty products average 30% ACOS. Electronics might average 15%. Comparing them is meaningless.

Solution: Benchmark against category competitors, not arbitrary targets.

Mistake 4: Overreacting to Short-Term Fluctuation

ACOS varies day-to-day. Panic adjustments based on 3-day data create volatility.

Solution: Make decisions on 14+ day windows minimum. 30-day preferred.

Mistake 5: Neglecting Organic Impact

Advertising drives organic rank. A 35% ACOS campaign might be profitable indirectly through improved organic visibility.

Solution: Measure total sales (organic + paid), not just ACOS.


Advanced ACOS Optimization

The ACOS-Volume Tradeoff Curve

There’s a relationship between ACOS and volume:

  • Lower bids → Lower ACOS, Lower Volume
  • Higher bids → Higher ACOS, Higher Volume

Find your optimal point based on:

  • Inventory levels
  • Margin structure
  • Growth objectives
  • Competitive pressure

Sometimes 22% ACOS on $50k spend beats 18% ACOS on $30k spend.

Competitive ACOS Strategy

Monitor competitor actions:

  • New entrants often bid aggressively (high ACOS temporarily)
  • Competitor stockouts create ACOS opportunities
  • Seasonal competitors exit, improving auction dynamics

Use tools like WisePPC to track competitor movements and adjust strategy.

Portfolio-Level Optimization

Advanced advertisers optimize across portfolio, not individual campaigns:

  • Set portfolio ACOS target (e.g., 22%)
  • Allow individual variation (brand: 10%, conquesting: 40%)
  • Rebalance monthly based on business priorities
  • Maintain portfolio target while optimizing components


Conclusion

Reducing ACOS isn’t about slashing bids and praying. It’s systematic diagnosis, surgical optimization, and strategic tradeoffs between efficiency and growth.

The advertisers who master ACOS don’t just follow generic best practices. They understand their specific situation: margin structure, product lifecycle, competitive dynamics, and business objectives. They segment intelligently. They measure granularly. They optimize continuously.

Start with diagnosis—understand why your ACOS is where it is. Apply the strategies in order: bid management for quick wins, keyword precision for targeting efficiency, structure for long-term control, and conversion optimization for fundamental improvement.

Track progress weekly. Celebrate improvements. Learn from setbacks. ACOS optimization is a journey, not a destination.

Your path to profitable Amazon advertising starts with the first systematic adjustment. Make it today.


Quick Reference: ACOS Optimization Checklist

Weekly Tasks:

  • Review keywords with >$20 spend, 0 orders → Add negatives
  • Adjust bids on 1.5×+ ACOS keywords
  • Check search term reports for irrelevant traffic
  • Review placement performance, adjust modifiers

Monthly Tasks:

  • Audit campaign structure for efficiency
  • Analyze ACOS by product category
  • Test new keywords with conservative bids
  • Review and update negative keyword lists

Quarterly Tasks:

  • Restructure underperforming campaigns
  • Audit listing quality for high-ACOS products
  • Reassess ACOS targets by product margin
  • Competitive landscape analysis


Ready to take control of your ACOS? Try WisePPC for advanced analytics and optimization tools designed for serious Amazon advertisers.

The Complete Guide to Amazon PPC Bulk Campaign Management

Introduction

If you’re managing more than a handful of Amazon PPC campaigns, you’ve felt the pain. Opening campaign after campaign. Clicking through endless tabs. Making the same bid adjustment fifty times. Copy-pasting keywords between ad groups. Watching precious hours evaporate while your competition moves faster.

The median Amazon advertiser manages 12-15 campaigns per account. Power sellers and agencies often juggle 100+. At that scale, manual management isn’t just inefficient—it’s impossible. You can’t optimize what you can’t touch, and most of your campaigns sit in “set it and forget it” purgatory, slowly bleeding budget on underperformers while winners starve for attention.

Bulk campaign management changes the equation. Instead of one-by-one edits, you operate on dozens, hundreds, or thousands of entities simultaneously. A 30-minute optimization session suddenly accomplishes what used to take entire days. More importantly, you can actually maintain optimized campaigns rather than letting them decay between sporadic check-ins.

This guide covers everything you need to master Amazon PPC bulk operations: from native Amazon tools to advanced third-party solutions, practical workflows to avoid common pitfalls, and strategies to scale your advertising without scaling your workload.


Why Bulk Management Matters More Than Ever

The Scale Problem in Modern Amazon Advertising

Amazon’s advertising platform has evolved dramatically. What started as a simple keyword bidding system has expanded into a complex ecosystem:

  • Sponsored Products with automatic and manual targeting
  • Sponsored Brands with video, store spotlight, and custom image formats
  • Sponsored Display with audience and product targeting
  • Demand-Side Platform (DSP) for programmatic display
  • Multiple match types (exact, phrase, broad, negative)
  • Placement modifiers for top of search and product pages
  • Dayparting and schedule-based bid adjustments
  • Portfolio-level budgeting and bidding strategies

Each of these dimensions multiplies your management surface area. A single SKU might have campaigns across three ad types, twenty keywords across three match types, placement adjustments, and negative keyword lists. Multiply by your catalog size, and you’re looking at thousands of individual settings requiring ongoing optimization.

The Hidden Cost of Manual Management

Let’s quantify the problem. A typical optimization workflow for a single campaign includes:

  1. Review performance metrics (30 seconds)
  2. Identify underperforming keywords (1 minute)
  3. Adjust bids or pause keywords (30 seconds)
  4. Add negative keywords (1 minute)
  5. Update campaign settings if needed (30 seconds)

That’s roughly 4 minutes per campaign. For 50 campaigns, you’re at 3+ hours for a single optimization pass. And that’s assuming you don’t get distracted, make errors, or need to navigate between multiple browser tabs and reports.

Most advertisers give up. They optimize their top 10-20 campaigns and ignore the rest. The result? Suboptimal performance across 60-80% of ad spend. It’s like leaving money on the table because picking it up takes too long.

What Bulk Management Enables

Bulk operations flip this dynamic entirely:

Speed: Complete optimization workflows in minutes, not hours. Apply changes across your entire account simultaneously.

Consistency: Apply the same optimization logic everywhere. No campaigns fall through the cracks because you ran out of time.

Testing: Run systematic experiments across campaign groups. Test bid strategies, targeting approaches, or ad creative at scale.

Responsiveness: React quickly to market changes. When competitors launch, budgets shift, or seasons change, update everything in one action.

Strategic Focus: Spend less time on mechanical edits and more time on strategic decisions—budget allocation, new opportunities, competitive positioning.


Understanding Amazon’s Native Bulk Tools

Amazon provides several built-in options for bulk management, each with different capabilities and limitations.

Bulk Operations in Campaign Manager

The simplest bulk option lives inside the standard Campaign Manager interface. Amazon allows basic multi-select operations:

Campaign-Level Actions:

  • Enable/pause multiple campaigns
  • Adjust daily budgets
  • Modify end dates
  • Change campaign names

Ad Group Actions:

  • Adjust default bids for multiple ad groups
  • Enable/pause ad groups

Keyword/Target Actions:

  • Adjust bids for selected keywords
  • Enable/pause keywords
  • Add negative keywords

These operations work through checkboxes and bulk action dropdowns. They’re accessible, require no technical knowledge, and handle the most common use cases.

Limitations:

  • Limited to visible items per page (typically 50-100)
  • No advanced filtering or segmentation
  • Cannot bulk edit keyword text or match types
  • No formula-based bid adjustments
  • Cannot export data for offline work

Best for: Simple status changes, budget adjustments, and basic bid tweaks on small-to-medium accounts.

Bulk Files (Spreadsheet Uploads)

For more complex operations, Amazon offers bulk file uploads through the Campaign Manager:

  1. Download a bulk file template for your account
  2. Edit the spreadsheet with your changes
  3. Upload the modified file back to Amazon
  4. Review and apply changes

Bulk files support virtually all campaign entities: campaigns, ad groups, keywords, product targets, negative keywords, and campaign settings. You can create new entities, modify existing ones, or delete items by marking them for removal.

Capabilities:

  • Full entity lifecycle management
  • Advanced formulas and calculations in Excel/Google Sheets
  • Offline editing and review
  • Template-based consistency

Limitations:

  • Steep learning curve for file format
  • Error-prone (formatting issues, missing required fields)
  • Slow feedback loop (download → edit → upload → review → fix errors)
  • Limited to ~10,000 rows per file
  • Cannot retrieve historical performance data

Best for: Major account restructuring, seasonal campaign builds, or advertisers comfortable with spreadsheet workflows.

Amazon Advertising API

For maximum flexibility, the Amazon Advertising API provides programmatic access to campaign management:

Capabilities:

  • Unlimited scale (only API rate limits apply)
  • Automated workflows and scheduling
  • Integration with business intelligence tools
  • Custom optimization algorithms
  • Real-time bid adjustments

Requirements:

  • Developer resources or third-party tools
  • API credentials and authentication
  • Understanding of API structure and limits
  • Error handling and retry logic

Best for: Large advertisers, agencies managing multiple accounts, or those wanting fully automated optimization.


Essential Bulk Management Workflows

Workflow 1: The Weekly Optimization Pass

Most accounts need regular optimization to maintain performance. Here’s a bulk workflow that handles 90% of routine maintenance:

Step 1: Identify Underperformers

Pull a keyword/target report for the last 30 days. Filter for:

  • Spend > $20 (statistically significant)
  • Orders = 0 (no conversions)
  • Click-through rate < 0.3% (poor relevance)

Step 2: Bulk Pause Non-Converters

Export the underperformer list. Use bulk operations to pause keywords meeting your criteria. With a tool like WisePPC, this takes one filter and a click. In native Amazon, you’ll need bulk files or manual selection.

Step 3: Adjust Bids on Marginal Performers

Filter for keywords with ACOS near your target (within 10%). These are close to profitable but need bid refinement. Apply a percentage-based bid adjustment:

  • ACOS 10% above target → reduce bid 15%
  • ACOS 10% below target → increase bid 10%

Step 4: Boost Winners

Identify top performers (low ACOS, high conversion rate). Increase bids 20-30% to capture more volume. Add these keywords to your “monitor closely” list for next week.

Step 5: Negative Keyword Maintenance

Review search term reports. Identify irrelevant queries driving clicks without conversions. Add these as negative keywords across relevant campaigns.

Time Investment: 30-45 minutes weekly with bulk tools vs. 4-6 hours manually.

Workflow 2: Seasonal Campaign Scaling

Prime Day, Black Friday, Q4—seasonal events require rapid campaign adjustments:

Pre-Event (2 Weeks Before)

  1. Duplicate top-performing campaigns with “Seasonal” naming
  2. Increase budgets 50-100% on seasonal campaigns
  3. Raise bids 20% on high-converting keywords
  4. Add seasonal negative keywords (outdated terms, last year’s models)

During Event (Daily)

  1. Monitor spend pacing—bulk adjust budgets if hitting caps
  2. Pause underperforming seasonal keywords quickly
  3. Shift budget to highest-converting campaigns in real-time

Post-Event (1 Week After)

  1. Bulk reduce bids to pre-event levels
  2. Pause seasonal-specific campaigns
  3. Transfer winning keywords from seasonal campaigns to evergreen ones
  4. Document learnings for next year

Bulk operations make this manageable. Without them, seasonal events become chaos.

Workflow 3: Account Restructuring

As accounts mature, structure often needs overhaul:

The Single Keyword Ad Group (SKAG) Migration

Many advertisers move from multi-keyword ad groups to SKAGs for better control and Quality Score optimization:

  1. Export all keywords from existing campaigns
  2. Create new campaign structure with one keyword per ad group
  3. Generate ad copy variations for each keyword
  4. Set initial bids based on historical performance
  5. Bulk upload new structure
  6. Run parallel for 2 weeks, then pause old campaigns

This would be impossible without bulk tools—thousands of individual ad group and ad creations.

The Portfolio Consolidation

When merging multiple seller accounts or brands:

  1. Export all campaigns from source accounts
  2. Modify campaign names for brand identification
  3. Adjust budgets for combined portfolio strategy
  4. Bulk upload to destination account
  5. Implement shared negative keyword lists
  6. Set up portfolio-level rules and automation


Advanced Bulk Strategies

Dynamic Bid Adjustments

Static bid management wastes money. These bulk strategies respond to performance signals:

Dayparting at Scale

Analyze performance by hour of day. Create bulk rules:

  • Increase bids 15% during high-converting hours (9 AM – 12 PM, 7 PM – 10 PM)
  • Decrease bids 20% during low-converting hours (12 AM – 6 AM)
  • Apply across all campaigns with single bulk operation

Position-Based Bidding

Some keywords perform best in specific ad positions:

  • Brand defense: Maintain top of search position 1
  • Category keywords: Target top of search position 2-3 for efficiency
  • Long-tail keywords: Accept lower positions for profitability

Bulk adjust bids based on placement reports to hit position targets without overspending.

Inventory-Aware Bidding

Connect ad spend to inventory levels:

  • Low stock (< 30 days): Reduce bids 40% to slow velocity
  • Well-stocked: Maintain normal bids
  • Overstock: Increase bids 25% to drive movement
  • Out of stock: Pause campaigns immediately

WisePPC’s inventory integration automates this, but you can approximate with weekly bulk updates based on inventory reports.

Bulk Negative Keyword Management

Negative keywords are as important as positive ones. Systematic bulk approaches:

The Universal Negative List

Maintain account-wide negative keywords applying to all campaigns:

  • Job seekers: “careers”, “jobs”, “employment”, “hiring”
  • Free seekers: “free”, “giveaway”, “sample”, “trial”
  • DIY types: “diy”, “homemade”, “how to make”, “build your own”
  • Information seekers: “wikipedia”, “what is”, “vs”, “compare”

Bulk apply these to new campaigns automatically.

Search Term Mining

Weekly bulk workflow:

  1. Download search term report
  2. Filter for terms with > $15 spend, 0 orders
  3. Copy to negative keyword list
  4. Bulk upload to relevant campaigns

Competitor Exclusions

For brand campaigns, bulk exclude competitor ASINs that consistently drive clicks without conversion from your product targeting.


Common Bulk Management Pitfalls

Pitfall 1: The Overcorrection

Bulk tools make big changes easy—sometimes too easy. Common mistakes:

  • Bid changes too aggressive: Dropping bids 50% instead of 15% kills volume
  • Pausing too broadly: Filtering error pauses winners along with losers
  • Budget reductions: Slashing budgets during low periods hurts algorithm learning

Prevention: Always preview changes. Start conservative. Implement in phases (25% of campaigns first, then expand).

Pitfall 2: Lost in Translation

Bulk file uploads fail constantly due to:

  • Incorrect column headers
  • Date format mismatches (MM/DD/YYYY vs. DD/MM/YYYY)
  • Encoding issues with special characters
  • Required field omissions
  • Campaign ID mismatches

Prevention: Use validation tools. Keep backup files. Test with small batches first. Document your exact file format that works.

Pitfall 3: Blind Automation

Automated bulk rules without oversight cause disasters:

  • Bid algorithms bid against each other
  • Seasonal trends ignored (low winter ACOS triggers bid reductions for summer products)
  • New products starved because they lack conversion history
  • Competitor actions not accounted for

Prevention: Set guardrails (max bid changes, minimum data thresholds). Review automated actions weekly. Maintain manual override capability.

Pitfall 4: Structural Debt

Bulk operations on poorly structured accounts amplify problems:

  • Duplicating broken campaign structures
  • Copying ineffective keyword sets
  • Scaling unoptimized targeting

Prevention: Fix structure before scaling. Audit campaigns quarterly. Archive rather than pause old campaigns to prevent confusion.


Tools for Bulk Management

Option 1: Native Amazon (Free, Limited)

Best for advertisers with:

  • Simple account structures
  • Budget constraints
  • Patience for manual processes
  • Tolerance for slower workflows

Cost: Free Best Feature: No additional learning curve Limitation: Time investment scales linearly with account size

Option 2: WisePPC (Advanced Bulk Operations)

WisePPC was built specifically for the scale problem in Amazon advertising:

Bulk Campaign Management:

  • Edit thousands of campaigns simultaneously
  • Advanced filtering (performance, structure, status)
  • Formula-based bid adjustments
  • Bulk copy/paste between campaigns
  • One-click status changes

Advanced Features:

  • Historical charts for any metric combination
  • Multi-dimensional analysis (see keyword × placement × time performance)
  • Inventory-aware automation
  • Portfolio-level reporting

Workflow Acceleration:

  • What takes 4 hours in native Amazon takes 20 minutes in WisePPC
  • Weekly optimization passes complete in one session
  • Seasonal scaling happens in real-time

Cost: Subscription-based (see wiseppc.com/pricing) Best For: Serious sellers, agencies, anyone managing 10+ campaigns Unique Advantage: Built by Amazon advertisers who experienced the pain firsthand

Option 3: Custom API Solutions

For enterprises with development resources:

Advantages:

  • Fully customized workflows
  • Integration with internal systems
  • Proprietary optimization algorithms

Disadvantages:

  • High development cost
  • Ongoing maintenance burden
  • API dependency and change management


Building Your Bulk Management System

Step 1: Audit Current State

Document your current workflow:

  • How many campaigns/ad groups/keywords do you manage?
  • How long does weekly optimization take?
  • Which tasks consume most time?
  • Where do errors typically occur?

Step 2: Prioritize Workflows

Identify highest-impact bulk operations:

  • Weekly optimization (immediate time savings)
  • Seasonal scaling (event readiness)
  • New product launches (growth enablement)
  • Account restructuring (long-term efficiency)

Step 3: Select Your Tool Stack

Match tools to needs:

  • Simple accounts: Native Amazon bulk operations
  • Growing accounts: WisePPC for efficiency
  • Enterprise: Custom API solutions or WisePPC with advanced integrations

Step 4: Build SOPs

Create standard operating procedures:

  • Weekly optimization checklist
  • Seasonal campaign templates
  • Negative keyword rules
  • Bid adjustment formulas

Step 5: Train and Document

Ensure team consistency:

  • Document exact processes
  • Create video walkthroughs
  • Maintain change logs
  • Establish review checkpoints


Measuring Bulk Management ROI

Time Savings

Track before and after:

  • Weekly optimization time
  • Seasonal preparation time
  • New campaign setup time
  • Error correction time

Typical improvement: 70-90% time reduction on mechanical tasks.

Performance Impact

Monitor account health:

  • Percentage of campaigns optimized weekly (target: 100%)
  • Time to market for new products
  • Response speed to performance changes
  • Optimization consistency across portfolio

Error Reduction

Count mistakes:

  • Accidental campaign pauses
  • Incorrect bid changes
  • Missing negative keywords
  • Duplicate targeting

Bulk tools with preview and validation reduce errors 60-80%.


Conclusion

Bulk campaign management isn’t a luxury for large advertisers—it’s a necessity for anyone serious about Amazon PPC performance. The platform’s complexity has outpaced manual management capabilities. Without bulk operations, you’re optimizing a fraction of your account while the majority runs on autopilot.

The question isn’t whether to adopt bulk management, but how quickly you can implement it. Every week of delay means wasted spend on underperformers, missed opportunities on winners, and competitive disadvantage against more agile advertisers.

Start with your highest-volume workflow. Build systematic approaches. Leverage tools like WisePPC designed for scale. Transform Amazon PPC from a time-consuming chore into a strategic competitive advantage.

Your campaigns—and your sanity—will thank you.


FAQ

Q: Can I use bulk operations without technical skills?

A: Yes. Tools like WisePPC provide intuitive interfaces for complex bulk actions. Native Amazon bulk files require more learning but are manageable with practice.

Q: What’s the risk of making bulk mistakes?

A: Significant, but manageable. Always preview changes. Start with small batches. Maintain backups. Most bulk tools have undo capabilities.

Q: How often should I run bulk optimizations?

A: Weekly for active accounts. High-spend campaigns may need daily monitoring. Seasonal periods require more frequent adjustments.

Q: Can bulk management hurt campaign performance?

A: Poorly executed bulk changes can. Well-planned bulk optimizations improve performance by ensuring consistent application of best practices across your entire account.

Q: Is WisePPC’s bulk management better than native Amazon?

A: For accounts with 10+ campaigns, typically yes. WisePPC offers faster workflows, better visualization, historical analysis, and automation that native tools lack.

Ready to transform your Amazon PPC workflow? Get started with WisePPC and complete your weekly optimization in minutes, not hours.

Amazon Analytics for Sellers: The Complete Guide to PPC Data, Reporting & Dashboards

Understanding your Amazon data isn’t just about knowing your sales numbers—it’s about uncovering the insights that drive profitable advertising decisions. With Amazon’s advertising ecosystem becoming increasingly complex, sellers who master analytics gain a significant competitive advantage.

This comprehensive guide breaks down everything you need to know about Amazon analytics, from essential metrics to advanced reporting techniques that can transform your PPC performance.


Why Amazon Analytics Matter More Than Ever

Amazon’s advertising platform has evolved dramatically over the past few years. What started as a simple sponsored products system has expanded into a sophisticated ecosystem spanning Sponsored Products, Sponsored Brands, Sponsored Display, and DSP.

The challenge? More ad types mean more data points. More data points mean more opportunities to optimize—or more chances to get lost in the noise.

Consider these numbers:

  • The average Amazon seller manages 8-12 campaigns simultaneously
  • Top-performing sellers review their analytics at least 3 times per week
  • Sellers who use dedicated analytics tools see 23% lower ACoS on average

Without a systematic approach to Amazon analytics, you’re essentially flying blind while your competitors navigate with precision instruments.


Essential Amazon PPC Metrics Every Seller Must Track

Not all metrics are created equal. Here’s how to prioritize what actually matters for your bottom line.

1. Advertising Cost of Sale (ACoS)

ACoS remains the north star metric for Amazon PPC. Calculated as:

ACoS = (Ad Spend / Ad Revenue) × 100

Why it matters: ACoS tells you directly whether your advertising is profitable. A 25% ACoS on a product with 30% margins means you’re losing money on every advertising-driven sale.

Benchmark targets:

  • Launch phase: 50-70% ACoS (acceptable for ranking new products)
  • Growth phase: 25-35% ACoS (sustainable for established products)
  • Profit phase: 15-25% ACoS (optimized for margin protection)

2. Total Advertising Cost of Sale (TACoS)

TACoS expands your view beyond direct ad-attributed sales:

TACoS = (Ad Spend / Total Revenue) × 100

Why it matters: Amazon advertising creates halo effects. A customer might click your ad for Product A but end up buying Product B—or return later to purchase without clicking an ad. TACoS captures this broader impact.

Red flag: If your ACoS is stable but TACoS is climbing, your organic sales are declining while ad dependency grows.

3. Return on Ad Spend (ROAS)

ROAS is simply the inverse of ACoS, expressed as a ratio:

ROAS = Ad Revenue / Ad Spend

Why it matters: Some sellers find ROAS more intuitive. A 4:1 ROAS means every $1 in ad spend generates $4 in revenue—the equivalent of a 25% ACoS.

4. Conversion Rate (CVR)

CVR = (Orders / Clicks) × 100

Why it matters: CVR reveals whether your listing converts browsers into buyers. A high click-through rate with low conversion usually indicates listing issues—poor images, uncompetitive pricing, or weak bullet points.

Industry benchmarks:

  • Average Amazon PPC CVR: 10-15%
  • Strong performing listings: 20-30%+
  • Listing optimization needed: Below 8%

5. Cost Per Click (CPC)

CPC trends reveal competitive dynamics in your category:

Why it matters: Rising CPCs indicate increasing competition. If your CPC climbs 20% while conversion rates stay flat, you’ll need to either improve your listing or accept lower margins.

6. Click-Through Rate (CTR)

CTR = (Clicks / Impressions) × 100

Why it matters: CTR measures your ad’s relevance and appeal. Low CTR suggests your targeting is off—or your creative needs work.

Benchmarks by ad type:

  • Sponsored Products: 0.3-0.5%
  • Sponsored Brands: 0.2-0.4%
  • Sponsored Display: 0.1-0.3%


Building Your Amazon Analytics Dashboard

Raw data becomes actionable through visualization. Here’s how to structure a dashboard that drives decisions.

Tier 1: Daily Pulse Check (5 Minutes)

Your daily dashboard should answer: “Is everything running normally?”

Essential widgets:

  • Total ad spend vs. daily budget
  • Overall ACoS vs. target
  • Top 5 campaigns by spend
  • Any campaigns with zero impressions (indicating issues)

Tier 2: Weekly Performance Review (30 Minutes)

Dig deeper into trends and patterns:

Key sections:

  • Week-over-week ACoS and ROAS comparison
  • Search term report analysis (top spenders, negative keyword opportunities)
  • Placement performance (top of search vs. product pages vs. rest of search)
  • ASIN-level profitability

Tier 3: Monthly Strategic Analysis (2 Hours)

Monthly reviews focus on strategic adjustments:

Focus areas:

  • Category benchmark comparisons
  • Seasonal trend identification
  • Budget reallocation opportunities
  • New keyword expansion opportunities
  • Campaign structure optimization


Amazon Analytics Tools: Build vs. Buy

Sellers face a choice: piece together native Amazon reporting or invest in third-party tools. Here’s how to evaluate your options.

Native Amazon Tools (Free)

Campaign Manager:

  • Real-time spend and performance data
  • Basic search term reports
  • Placement modifiers
  • Dayparting controls

Amazon Attribution:

  • Track off-Amazon traffic impact
  • Understand full-funnel customer journeys
  • Available at no cost for brand registered sellers

Limitations:

  • Data retention limited to 60 days for detailed reports
  • No automated reporting or alerts
  • Time-consuming manual analysis
  • Difficult to compare historical trends

Third-Party Amazon Analytics Tools

Benefits of dedicated tools:

  • Historical data storage beyond Amazon’s limits
  • Automated alerts for performance changes
  • Cross-account/cross-marketplace views
  • Advanced visualization and reporting
  • Time savings through automation

What to look for in an analytics tool:

  1. Data freshness: Real-time or near real-time updates
  2. Customization: Ability to create custom metrics and dashboards
  3. Integration: Connects with other tools in your stack
  4. Alerting: Proactive notifications for unusual patterns
  5. Export capabilities: Easy data extraction for further analysis


Advanced Amazon Analytics Techniques

Once you’ve mastered the basics, these advanced techniques can unlock additional performance gains.

Dayparting Analysis

Amazon’s native dayparting has limitations, but understanding hourly performance patterns still matters.

How to analyze:

  1. Download placement reports with hourly data
  2. Map conversion rates and ACoS by hour of day
  3. Identify high-performing time windows
  4. Adjust bids accordingly

Most sellers find their optimal hours cluster around:

  • Morning browsing (7-9 AM)
  • Lunch break shopping (12-2 PM)
  • Evening prime time (7-10 PM)

Placement Performance Optimization

Not all placements convert equally. Amazon offers three placement types:

Top of Search (First Page):

  • Highest visibility and CTR
  • Premium CPCs
  • Often worth the premium for brand visibility

Product Pages:

  • Defensive placement (protecting your listings from competitors)
  • Often lower CPCs
  • Conversion rates vary significantly by product

Rest of Search:

  • Remaining placements throughout Amazon
  • Volume play with potentially lower efficiency

Search Term Analysis at Scale

The search term report is gold—but mining it manually takes forever.

Effective process:

  1. Aggregate search terms across 30-90 days
  2. Identify high-spend, low-converting terms for negative keyword additions
  3. Find converting search terms not explicitly targeted for keyword expansion
  4. Calculate search term-level profitability to optimize bids

Portfolio-Level Optimization

Sophisticated sellers think beyond individual campaigns to portfolio performance:

Portfolio approach:

  • Group campaigns by product category, margin structure, or strategic priority
  • Set portfolio-level ACoS targets that balance profitability with growth
  • Use portfolio budgets to shift spend toward highest-opportunity areas


Common Amazon Analytics Mistakes (And How to Avoid Them)

Mistake #1: Focusing Only on ACoS

The problem: ACoS obsession can stunt growth. A product with 40% ACoS might be unprofitable now but building ranking that delivers organic sales later.

The solution: Track TACoS alongside ACoS to understand the full picture. Accept higher ACoS during launch phases with clear plans to optimize downward.

Mistake #2: Ignoring Attribution Windows

The problem: Amazon’s default reporting shows same-click attribution, but the advertising console offers 7-day, 14-day, and 30-day views.

The solution: Analyze trends across attribution windows. If 30-day ACoS is significantly lower than 7-day, your ads are driving consideration that converts later.

Mistake #3: Overlooking Organic Impact

The problem: Advertising affects organic ranking. Killing an “unprofitable” campaign might crater your organic sales.

The solution: Measure organic sales velocity before, during, and after significant campaign changes. Use holdout tests when possible.

Mistake #4: Analysis Paralysis

The problem: Spending more time analyzing than acting. Perfect analysis with no optimization wastes opportunity.

The solution: Set clear thresholds for action. If a keyword has spent 2x your target ACoS without conversion after 1,000 impressions, pause or negative it. Don’t overthink.


Amazon Analytics Checklist for Sellers

Use this checklist to audit your current analytics approach:

  • I review my Amazon advertising dashboard at least twice weekly
  • I track ACoS, TACoS, and ROAS consistently
  • I analyze search term reports for negative keyword opportunities monthly
  • I understand my conversion rates by placement type
  • I have a documented process for bid optimization decisions
  • I retain historical performance data beyond Amazon’s 60-day limit
  • I benchmark my metrics against category standards
  • I analyze hourly performance patterns for dayparting opportunities
  • I track organic sales velocity alongside advertising metrics
  • I have automated alerts set up for performance anomalies


Conclusion: Data-Driven Amazon Success

Amazon analytics mastery separates thriving sellers from those struggling to compete. The sellers winning in 2025 aren’t guessing—they’re measuring, analyzing, and optimizing systematically.

Start with the fundamentals: understand your ACoS, TACoS, and conversion rates. Build a consistent reporting rhythm. Then layer in advanced techniques as your sophistication grows.

Remember: analytics exist to drive action. The best dashboard in the world delivers zero value if you don’t use it to make better decisions about your Amazon advertising.

Ready to take your Amazon analytics to the next level? WisePPC helps sellers track metrics, identify optimization opportunities, and automate reporting—all in one intuitive dashboard. Learn more about WisePPC’s analytics capabilities or start your free trial today.

Last updated: March 2026

Amazon PPC Automation vs Manual Management: Finding the Right Balance

If you spend enough time inside Amazon Ads, you eventually run into the same question: should campaigns be automated or managed manually? On paper, automation promises efficiency and scale. Manual management promises control and precision. In reality, most accounts struggle not because they chose the wrong approach, but because they leaned too far in one direction.

Amazon advertising has simply become too complex to handle entirely by hand, yet too connected to real business decisions to leave fully to algorithms. Bids, budgets, inventory pressure, launches, margins, brand positioning – none of these exist in isolation. Good performance usually comes from knowing when to let systems handle repetitive work and when to step in and make deliberate choices.

This article looks at both sides without trying to crown a winner. The goal is to understand what automation actually does well, where manual management still matters, and how experienced advertisers combine both without losing control of the account.


Why This Debate Exists In The First Place

The automation versus manual argument exists because Amazon PPC sits at the intersection of data and judgment. Some decisions are purely numerical. Others depend on context that software cannot fully understand.

Automation thrives on repetition. Bid adjustments, budget pacing, keyword harvesting, and performance monitoring all follow patterns that machines can execute faster and more consistently than humans. When campaigns scale into thousands of keywords, manual management alone becomes unrealistic.

At the same time, Amazon advertising is not just a math problem. Inventory levels change. Margins shift. Product launches require temporary inefficiency. Competitor behavior alters strategy overnight. These are business decisions, not optimization problems. Algorithms respond to metrics, not intent.

Most frustrations with automation come from expecting it to solve strategic problems. Most frustrations with manual management come from trying to handle operational volume without tools. The tension between the two approaches comes from misunderstanding their roles.


What Automation Actually Does Well

Automation works best when the task is frequent, rule-based, and does not require interpretation beyond predefined thresholds. In other words, when consistency matters more than creativity.


Bid Adjustments at Scale

Bid management is the most obvious example. Performance changes constantly across keywords and placements. A human cannot realistically monitor every change in real time, especially in large accounts. Automation can apply consistent logic around the clock, adjusting bids based on performance signals without fatigue or delay.

This is not about replacing judgment. It is about executing decisions faster once the rules are defined. A well-configured system follows the logic you set, not its own agenda.


Budget Pacing and Allocation

Manual budget management often creates inefficiency without anyone noticing. Strong campaigns run out of budget early while weaker campaigns continue spending. Automation can rebalance spend within defined limits, keeping total budgets intact while directing spend toward better performers.

The key detail here is guardrails. Automation works when limits are clear. Without them, it can optimize toward short-term metrics that do not reflect business goals.


Search Term Harvesting and Negatives

Moving converting search terms into structured campaigns and filtering out poor performers is repetitive work. It follows clear logic and happens continuously. Automation handles this well because the decision criteria rarely change. Humans still review results, but the sorting itself does not require daily attention.


Maintenance of Mature Campaigns

Once campaigns reach stability, most work becomes incremental. Small bid adjustments, minor budget shifts, and routine optimization dominate. This is maintenance, not strategy. Automation frees time that would otherwise be spent on low-impact tasks.

The common thread across these examples is simple. Automation excels when the question is “how often” rather than “why.”


Ad Impact and Revenue Attribution Control With WisePPC

At WisePPC, we see automation as support, not replacement. The goal is to make campaign management faster and clearer without taking decisions away from the people running the business. Amazon advertising moves quickly, and without reliable data it becomes easy to react instead of act with intention. Our approach focuses on giving teams visibility first, then automation second.

We built WisePPC around clear analytics and practical execution. Real-time performance tracking, advanced filtering, and long-term historical data help teams understand what is actually driving results across ads and sales. Instead of relying on assumptions, advertisers can see trends, compare performance over time, and make decisions based on context rather than short-term fluctuations.

Automation then handles the repetitive side of campaign management. Bulk updates, bid adjustments, and performance monitoring reduce manual workload while keeping control in human hands. The idea is simple – remove complexity where it slows teams down, so they can spend more time on strategy, growth, and the decisions that actually move the business forward.


Where Manual Management Still Matters

Despite improvements in automation tools, some areas remain firmly human-led. These are the places where context matters more than speed.


Campaign Architecture and Targeting Logic

How campaigns are structured determines everything that happens later. Product grouping, match type segmentation, branded versus non-branded separation, and competitor targeting approaches shape data quality and control.

Automation cannot design architecture. It can only operate within it. Poor structure leads to poor automation outcomes, no matter how advanced the tool.


Product Launches and Ranking Phases

Launch periods break most automated logic. Early campaigns often run inefficiently on purpose to build visibility and momentum. Automation typically interprets this as poor performance and reduces bids or spend, undermining the strategy.

Humans understand phases. A launch has different goals in week one than in week six. Automation does not recognize intent unless someone actively adjusts the rules.


Creative Direction and Messaging

Automation can test variations, measure click-through rates, and identify winners. It cannot decide what story a brand should tell or why a message resonates. Creative decisions depend on positioning, audience understanding, and brand consistency across channels.

The testing framework can be automated. The thinking behind what to test cannot.


Business-Level Decisions

Advertising performance rarely exists in isolation. Inventory shortages, cash flow considerations, pricing changes, or broader brand strategy all influence how aggressively ads should run. These decisions involve trade-offs beyond campaign metrics.

An algorithm sees performance data. A human sees the business behind it.


Amazon PPC Automation Vs Manual Management: Pros and Cons

Looking at automation and manual management side by side makes the trade-offs easier to understand. Neither approach is universally better. Each solves a different problem, and most successful accounts rely on both depending on the task and stage of growth.

Approach Pros Cons
Automation Handles large data volumes efficiently Can optimize for the wrong metric if rules are poorly set
Applies changes consistently without fatigue May react poorly to unusual situations like stockouts or launches
Saves time on repetitive tasks Requires ongoing supervision and rule adjustments
Faster reaction to performance changes Less awareness of business context or strategy
Scales easily across large catalogs Can reduce visibility into why changes happen
Manual Management Full control over bids, structure, and targeting Difficult to scale across large accounts
Easier to apply business context and judgment Slower reaction to performance shifts
Greater flexibility for testing and experimentation Time-intensive and operationally heavy
Better suited for launches and strategic phases Higher risk of inconsistency or missed signals
Deeper understanding of account behavior over time Can limit strategic work if too much time is spent on execution


The table makes one thing clear. Automation improves execution speed and consistency, while manual management improves decision quality. The balance comes from letting each do what it does best rather than forcing one approach to handle everything.


The Hybrid Approach Most Experienced Teams Use

The strongest Amazon advertisers rarely choose sides. Instead, they divide responsibilities.

Machines handle execution. Humans handle direction.

A practical way to think about this is in three layers:

  • Automate repetitive execution such as bid adjustments, harvesting, and budget pacing.
  • Supervise performance at the portfolio level to ensure automation aligns with business goals.
  • Own strategic decisions like launches, structure, and creative direction.

This structure reduces workload without removing accountability. Automation becomes an extension of strategy rather than a replacement for it.

The difference is subtle but important. Automation should follow strategy, not define it.


How to Decide What to Automate In Your Own Account

There is no universal setup because every account differs in scale, margins, and goals. Still, a simple exercise helps clarify decisions.

Start by listing recurring tasks performed weekly or monthly. Bid updates, search term analysis, campaign creation, reporting, budget allocation, creative testing. Then ask a straightforward question for each task: does this require judgment every time?

A practical way to work through this looks like this:

  1. List all recurring PPC tasks. Include everything your team touches regularly, from bid adjustments and keyword harvesting to reporting and campaign setup.
  2. Evaluate decision complexity. Ask whether the task follows clear rules or requires interpretation and business context.
  3. Assign ownership. Tasks that rarely need judgment belong in automation. Tasks that occasionally require intervention should be supervised. Tasks driven by strategy should remain human-led.
  4. Consider reaction speed. If performance improves when changes happen quickly and consistently, automation usually makes sense. If timing and context matter more, manual control is safer.
  5. Review outcomes regularly. Automation decisions are not permanent. Revisit them as campaigns scale, margins change, or business priorities shift.

This process shifts the conversation away from tools and toward ownership, which is usually where better decisions start.


Finding the Right Balance Over Time

Balance is not static. Accounts evolve.

Early-stage sellers often rely more on manual control while learning what drives performance. As catalogs grow and data becomes cleaner, automation gradually takes over repetitive tasks. During launches or strategic shifts, manual involvement increases again.

The balance moves with the business. What worked six months ago may not make sense today. Periodic reviews of automation rules and manual workflows prevent drift.

This is where many accounts quietly lose efficiency. Automation is set once and forgotten, or manual habits persist long after they stop adding value.


Conclusion

Amazon PPC automation versus manual management is not a competition with a clear winner. Both exist because Amazon advertising demands different types of decisions at different moments. Automation brings speed, consistency, and scale. Manual management brings judgment, context, and strategic intent.

Accounts struggle when one replaces the other entirely. They improve when responsibilities are clear. Let machines handle the repetitive work that drains time and attention. Keep humans focused on decisions that shape direction and risk.

In the end, the goal is not to automate more or manage more manually. It is to make sure every decision in the account is owned by the right layer. When that happens, automation stops feeling risky and manual work stops feeling overwhelming. The system simply works the way it should.


Frequently Asked Questions

Is Amazon PPC automation better than manual management?

Neither approach is universally better. Automation works well for repetitive, data-heavy tasks that require speed and consistency, while manual management is stronger when decisions involve strategy, launches, or business context. Most successful accounts use a combination of both rather than choosing one exclusively.

Can automation fully manage an Amazon PPC account?

In practice, no. Automation can handle execution such as bid adjustments or budget pacing, but it cannot understand inventory constraints, profit goals, or brand positioning. Human supervision is still necessary to ensure automated decisions align with overall business objectives.

When should campaigns be managed manually?

Manual management makes the most sense during product launches, major strategy shifts, creative testing, or when restructuring campaigns. These situations require judgment and flexibility that automation cannot reliably provide on its own.

Does automation always improve performance?

Not automatically. Automation improves efficiency when rules and goals are set correctly. Poorly configured automation can optimize toward the wrong metrics or react too aggressively to short-term changes, which may hurt long-term growth.

How often should automated rules be reviewed?

A light review once a month is usually enough to catch unexpected behavior, while a deeper review every quarter helps ensure thresholds and goals still match margins, competition, and business priorities.

How to Optimize Sponsored Products Campaigns Without Wasting Budget

Running Sponsored Products is easy. Running them profitably is not.

Most campaigns don’t fail because of bad products. They fail because no one is really steering them. Keywords pile up. Bids drift. Budgets get spread thin. And suddenly ACoS climbs without a clear reason.

Optimization is not about constant tinkering. It’s about knowing what to measure, what to cut, and what to scale. When you focus on the right signals, small adjustments can change the direction of an entire account. Let’s break down how to do it properly.


The Core Framework for Efficient Sponsored Products Optimization

Optimizing Sponsored Products is not about chasing every fluctuation in your dashboard. It is about building a system that makes smart decisions predictable.

Most wasted budget does not disappear in one dramatic mistake. It leaks through small gaps – broad keywords left unchecked, bids that were never revisited, budgets spread too thin across too many campaigns. Over time, those gaps compound.

The framework below focuses on control. Not hacks. Not shortcuts. Just the areas that consistently separate profitable accounts from unstable ones. If you work through these methodically, you stop reacting to performance and start steering it.


1. Define the Role of Each Campaign Before You Touch Anything

Before adjusting bids or pausing keywords, ask one simple question: what is this campaign meant to achieve?

Sponsored Products Can Serve Different Goals

  • Launching new products
  • Protecting branded traffic
  • Scaling top sellers
  • Clearing inventory
  • Improving organic ranking

Each goal justifies a different tolerance for ACoS.

A launch campaign might accept aggressive spending. A mature product should operate closer to target profitability. If you optimize everything toward the same metric, you lose strategic control.

Clarity comes first. Adjustments come second.


2. Make Sure the Product Page Can Convert

If your conversion rate is low, the issue is not bidding. It is the product page.

Sponsored Products amplify what already exists. If your listing converts well, ads accelerate growth. If it does not, you are simply paying to send traffic into friction.

Before increasing spend, review:

  • Main image clarity. Your main image competes directly on the search results page. If it looks dull, cropped poorly, low contrast, or weaker than competitors, your click-through rate will suffer before the shopper even reaches your listing.
  • Title relevance. The title must clearly match the keywords you are targeting. If you are bidding on specific features or variations, those should be visible immediately. Relevance improves both CTR and conversion.
  • Bullet point structure. Bullet points should remove hesitation. They need to explain benefits, use cases, and key differentiators. Vague or generic bullets increase bounce rate.
  • Review volume and rating. Social proof drives paid performance. Low ratings or very few reviews make ads less efficient because trust is missing.
  • Pricing competitiveness. Price must align with positioning. If you are premium, the listing must justify it. If you compete on value, that advantage should be obvious.
  • Stock availability. Running ads on unstable inventory leads to wasted budget and ranking volatility. You cannot scale what you cannot consistently ship.

Higher conversion rate lowers effective ACoS without touching your bids. That is the cleanest form of optimization. It happens before the click.


3. Clean Up Your Campaign Structure

Messy structures hide waste.

Avoid Mixing

  • Automatic and manual targeting
  • Broad, phrase, and exact match
  • Branded and non-branded traffic
  • Experimental and proven ASINs

Instead, separate them. When match types are isolated, performance becomes visible. You can scale exact without overfeeding broad. You can cut waste without damaging winners.

Structure reduces confusion. Confusion causes overspending.


4. Turn Automatic Campaigns Into Research Machines

Automatic campaigns are not meant to sit untouched.

Their real value is not automation. It is discovery. They reveal how shoppers actually search, which variations convert, and which assumptions were wrong. Let them collect enough search term data before making decisions. Once meaningful data accumulates, review it carefully. Identify search terms that generated real conversions. These are strong candidates to move into manual exact campaigns, where you gain tighter control and better scaling potential.

At the same time, look for terms that consumed spend but produced no sales. Patterns matter here. One click is noise. Repeated wasted spend is a signal. Those terms either need lower bids or should be added as negative keywords.

Also pay attention to ASIN targets inside automatic campaigns. Sometimes product targeting opportunities appear unexpectedly. Strong-performing ASINs can be isolated into dedicated manual campaigns for more strategic control.

Automatic targeting should continuously feed your manual structure. If you let it run without review, wasted budget does not disappear dramatically. It simply drains quietly in the background.


5. Aggressively Remove Irrelevant Traffic

Wasted clicks are rarely dramatic. They accumulate quietly over time.

Search term reports often reveal patterns that explain where budget disappears. Broad keywords may pull in loosely related traffic that looks relevant on the surface but does not match buyer intent. Informational queries can generate impressions and clicks from shoppers who are still researching rather than ready to purchase. And sometimes you will find completely irrelevant variations that simply slipped through automated targeting.

These are not catastrophic mistakes. They are small leaks. But left unchecked, they slowly erode efficiency and inflate ACoS without obvious warning signs.

Add clear mismatches as negative exact or phrase. This improves:

  • CTR
  • Conversion rate
  • Overall ACoS

Be precise, not reckless. Only block what clearly will not convert.


6. Manage Bids With Thresholds, Not Emotion

Do not increase bids because of one good day. Do not pause a keyword after two bad clicks. Short-term fluctuations are normal. Emotional reactions create instability.

Follow Clear Rules

  1. Reduce bids when spend exceeds your acceptable CPA without conversions. If a keyword consistently burns budget past your target threshold, lower the bid in controlled steps rather than cutting it entirely.
  2. Increase bids gradually for profitable keywords. When a keyword performs below your target ACoS and drives steady sales, scale it slowly. Small increases protect efficiency while expanding volume.
  3. Pause only after meaningful data. A few clicks mean nothing. Wait until the keyword has generated enough spend to make a statistically reasonable decision.

Bid decisions should reflect product margin and long-term goals, not frustration from a single data point.


7. Optimize Placements Intentionally

Sponsored Products allow you to adjust placements, including top of search, product pages, and rest of search. Each of these positions behaves differently, and they rarely perform at the same level.

Instead of treating them equally, pull placement reports and analyze the differences. Compare conversion rate, ACoS, and revenue concentration across placements. Sometimes top of search drives higher CPC but significantly stronger conversion. In other cases, product page placements may generate lower volume but better efficiency.

If top of search converts substantially better, increasing its placement multiplier can improve overall campaign performance, even if CPC rises slightly. The key is to evaluate results based on profit impact, not just click cost.

Placement strategy is often underused. Yet it has a direct influence on profitability and deserves the same level of attention as keyword bidding.


8. Control Budget Allocation Strategically

Daily budget is not just a cap. It is a lever.

If profitable campaigns run out of budget early, you miss high-intent traffic. If weak campaigns have unlimited room, they burn spend.

Reallocate

  • Increase budget on stable, profitable campaigns
  • Limit budget on volatile or testing campaigns
  • Avoid spreading small budgets across too many experiments

Concentrated spend often performs better than diluted spend.


9. Separate Top Sellers From Experimental Products

Scale What Already Works

Top sellers convert better. They already have reviews, stronger ranking signals, and buyer trust. They generate momentum naturally, which means paid traffic works more efficiently for them.

Instead of mixing these products with experimental or underperforming ASINs, isolate them.

Create Dedicated Campaigns for Proven Winners

Top sellers deserve their own structure. That typically means:

  • Dedicated exact match campaigns focused on high-intent keywords
  • Higher budget ceilings so they do not run out of spend early in the day
  • More aggressive placement adjustments, especially for top of search

When you isolate strong performers, you can scale them confidently without inflating costs for weaker products.

Do Not Overfeed Weak ASINs

Underperforming or experimental products should not consume the same share of budget as proven winners. Testing is important, but it must be controlled.

Protect and scale what already works first. Let strength dictate growth. When budget follows performance, efficiency improves naturally.

Growth should follow strength, not hope.


10. Monitor Conversion Delay Before Cutting Spend

Not every click turns into a purchase within minutes. In many categories, especially higher-priced or more considered products, shoppers compare options, read reviews, and come back later.

Higher-priced products often convert days after the initial click. This delay is completely normal.

Amazon attributes conversions within a defined window, which means sales may appear several days after the original ad interaction. If you evaluate performance based only on same-day results, you risk misreading the data. A keyword may look unprofitable today but convert tomorrow.

Aggressively reducing bids or pausing keywords too quickly can eliminate traffic that is actually working on a delayed cycle. This creates unnecessary volatility in your campaigns.

Instead, evaluate performance over appropriate time frames. Give campaigns enough data before making structural changes. Look at trends over several days or weeks rather than reacting to daily swings.

Optimization without patience creates instability. Smart optimization balances responsiveness with perspective.


11. Build a Consistent Optimization Routine

Optimization works best as a rhythm, not a reaction.

Constantly changing bids every few hours usually creates instability. Ignoring campaigns for weeks creates waste. The middle ground is structured consistency.

Below is a practical review framework you can follow:

Frequency What to Focus On Why It Matters
Daily Check for anomalies or extreme overspend Prevents runaway spend and catches sudden performance drops early
Weekly Review search term reports Identifies new converting terms and wasted spend patterns
Adjust bids logically Keeps performance aligned with target ACoS or ROAS
Expand negative keyword lists Reduces irrelevant traffic and protects budget
Monthly Reevaluate campaign structure Ensures campaigns remain organized and scalable
Reallocate budgets Shifts spend toward profitable campaigns
Analyze placement trends Optimizes top of search and product page performance strategically


Consistency prevents budget waste from creeping back in. Small, disciplined reviews are far more effective than large, reactive overhauls.


Turning Strategy Into Action With WisePPC

All the principles above sound simple on paper. In reality, managing them across dozens of campaigns and thousands of keywords can get overwhelming fast.

That is exactly why we built WisePPC.

As an Amazon Ads Verified Partner, WisePPC uses official integrations to pull advertising and sales data into one structured environment. Instead of switching between fragmented reports and short data windows, the platform provides long-term historical performance, real-time metrics, and placement-level insights in one clean dashboard.

WisePPC removes guesswork from optimization by turning raw data into actionable clarity. Bulk actions allow bids and budgets to be adjusted in seconds. Advanced filtering isolates high-spend, low-return targets instantly. Visual performance highlights make anomalies easy to spot. And because data is stored for years rather than weeks, seasonality, long-term trends, and structural shifts remain visible.

It is not about adding more data. It is about making decisions clearer.

When revenue drivers, wasted spend, and the relationship between ads and organic sales become transparent, optimization stops being reactive. It becomes intentional.

That is how scaling should feel.


Final Thoughts

Sponsored Products do not need constant dramatic changes. They need structured oversight.

When campaigns have clear goals, clean architecture, controlled bidding, and disciplined review cycles, wasted budget becomes easier to spot. Profitability becomes easier to scale.

Optimization is not about squeezing every cent today. It is about building a system that stays efficient tomorrow.

And once you reach that point, Sponsored Products stop feeling unpredictable. They start feeling intentional.


Frequently Asked Questions

How often should I optimize Sponsored Products campaigns?

Light monitoring should happen daily to catch anomalies or sudden overspend. Structural optimization, such as reviewing search terms and adjusting bids, works best on a weekly basis. Larger decisions like restructuring campaigns or reallocating budgets should be done monthly. Constant tinkering creates instability, while structured reviews create control.

What is the biggest cause of wasted budget in Sponsored Products?

The most common cause is unreviewed search terms. Broad or automatic targeting often pulls in loosely related traffic that consumes spend without converting. Over time, these small leaks compound. Regular negative keyword management and search term analysis prevent most unnecessary spend.

Should I use automatic or manual campaigns for optimization?

Both serve different purposes. Automatic campaigns are valuable for discovery and keyword harvesting. Manual campaigns give you precision and control. The most efficient accounts use automatic campaigns to gather data and manual campaigns to scale proven keywords.

When should I pause a keyword?

Pause a keyword only after it has accumulated meaningful data. A few clicks without conversions do not justify removal. If spend consistently exceeds your acceptable cost per acquisition without results, reduce bids first. Pause only when performance clearly indicates long-term inefficiency.

How long should I wait before making changes to a new campaign?

Allow enough time for data to stabilize. For most products, that means at least several days to a couple of weeks depending on traffic volume. Also consider conversion delay, especially for higher-priced products. Optimizing too early can eliminate keywords that would have converted later.

success icon

Thank you for submitting request.

We will get back to you ASAP.