Understanding your Amazon data isn’t just about knowing your sales numbers—it’s about uncovering the insights that drive profitable advertising decisions. With Amazon’s advertising ecosystem becoming increasingly complex, sellers who master analytics gain a significant competitive advantage.
This comprehensive guide breaks down everything you need to know about Amazon analytics, from essential metrics to advanced reporting techniques that can transform your PPC performance.
Why Amazon Analytics Matter More Than Ever
Amazon’s advertising platform has evolved dramatically over the past few years. What started as a simple sponsored products system has expanded into a sophisticated ecosystem spanning Sponsored Products, Sponsored Brands, Sponsored Display, and DSP.
The challenge? More ad types mean more data points. More data points mean more opportunities to optimize—or more chances to get lost in the noise.
Consider these numbers:
- The average Amazon seller manages 8-12 campaigns simultaneously
- Top-performing sellers review their analytics at least 3 times per week
- Sellers who use dedicated analytics tools see 23% lower ACoS on average
Without a systematic approach to Amazon analytics, you’re essentially flying blind while your competitors navigate with precision instruments.
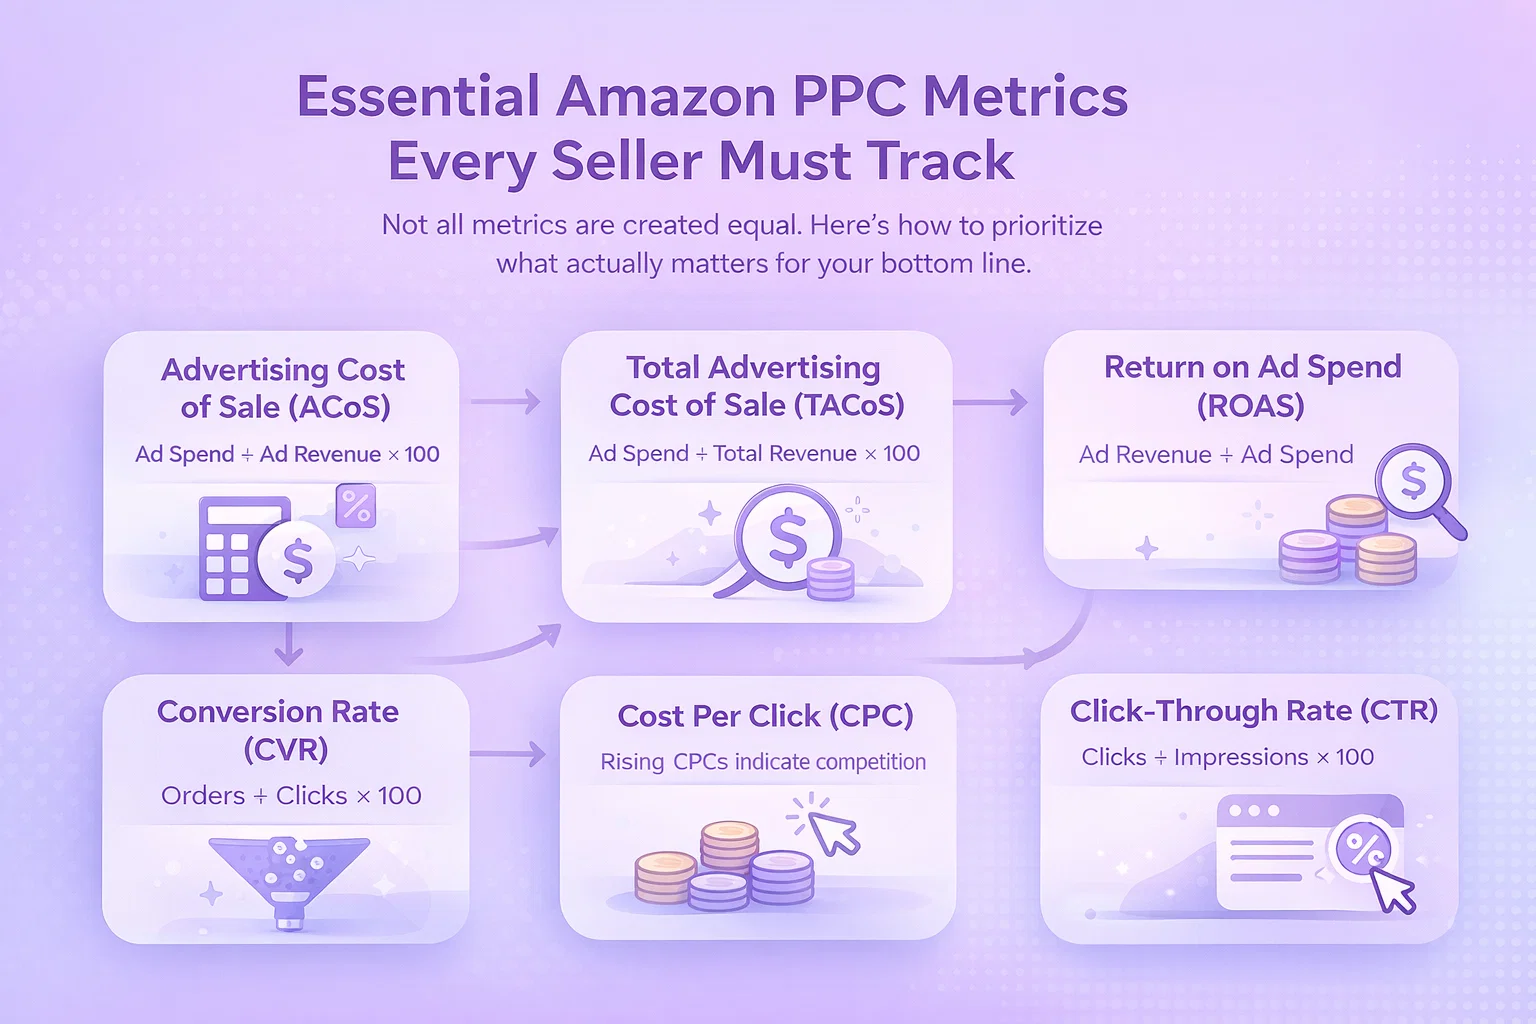
Essential Amazon PPC Metrics Every Seller Must Track
Not all metrics are created equal. Here’s how to prioritize what actually matters for your bottom line.
1. Advertising Cost of Sale (ACoS)
ACoS remains the north star metric for Amazon PPC. Calculated as:
ACoS = (Ad Spend / Ad Revenue) × 100
Why it matters: ACoS tells you directly whether your advertising is profitable. A 25% ACoS on a product with 30% margins means you’re losing money on every advertising-driven sale.
Benchmark targets:
- Launch phase: 50-70% ACoS (acceptable for ranking new products)
- Growth phase: 25-35% ACoS (sustainable for established products)
- Profit phase: 15-25% ACoS (optimized for margin protection)
2. Total Advertising Cost of Sale (TACoS)
TACoS expands your view beyond direct ad-attributed sales:
TACoS = (Ad Spend / Total Revenue) × 100
Why it matters: Amazon advertising creates halo effects. A customer might click your ad for Product A but end up buying Product B—or return later to purchase without clicking an ad. TACoS captures this broader impact.
Red flag: If your ACoS is stable but TACoS is climbing, your organic sales are declining while ad dependency grows.
3. Return on Ad Spend (ROAS)
ROAS is simply the inverse of ACoS, expressed as a ratio:
ROAS = Ad Revenue / Ad Spend
Why it matters: Some sellers find ROAS more intuitive. A 4:1 ROAS means every $1 in ad spend generates $4 in revenue—the equivalent of a 25% ACoS.
4. Conversion Rate (CVR)
CVR = (Orders / Clicks) × 100
Why it matters: CVR reveals whether your listing converts browsers into buyers. A high click-through rate with low conversion usually indicates listing issues—poor images, uncompetitive pricing, or weak bullet points.
Industry benchmarks:
- Average Amazon PPC CVR: 10-15%
- Strong performing listings: 20-30%+
- Listing optimization needed: Below 8%
5. Cost Per Click (CPC)
CPC trends reveal competitive dynamics in your category:
Why it matters: Rising CPCs indicate increasing competition. If your CPC climbs 20% while conversion rates stay flat, you’ll need to either improve your listing or accept lower margins.
6. Click-Through Rate (CTR)
CTR = (Clicks / Impressions) × 100
Why it matters: CTR measures your ad’s relevance and appeal. Low CTR suggests your targeting is off—or your creative needs work.
Benchmarks by ad type:
- Sponsored Products: 0.3-0.5%
- Sponsored Brands: 0.2-0.4%
- Sponsored Display: 0.1-0.3%
Building Your Amazon Analytics Dashboard
Raw data becomes actionable through visualization. Here’s how to structure a dashboard that drives decisions.
Tier 1: Daily Pulse Check (5 Minutes)
Your daily dashboard should answer: “Is everything running normally?”
Essential widgets:
- Total ad spend vs. daily budget
- Overall ACoS vs. target
- Top 5 campaigns by spend
- Any campaigns with zero impressions (indicating issues)
Tier 2: Weekly Performance Review (30 Minutes)
Dig deeper into trends and patterns:
Key sections:
- Week-over-week ACoS and ROAS comparison
- Search term report analysis (top spenders, negative keyword opportunities)
- Placement performance (top of search vs. product pages vs. rest of search)
- ASIN-level profitability
Tier 3: Monthly Strategic Analysis (2 Hours)
Monthly reviews focus on strategic adjustments:
Focus areas:
- Category benchmark comparisons
- Seasonal trend identification
- Budget reallocation opportunities
- New keyword expansion opportunities
- Campaign structure optimization
Amazon Analytics Tools: Build vs. Buy
Sellers face a choice: piece together native Amazon reporting or invest in third-party tools. Here’s how to evaluate your options.
Native Amazon Tools (Free)
Campaign Manager:
- Real-time spend and performance data
- Basic search term reports
- Placement modifiers
- Dayparting controls
Amazon Attribution:
- Track off-Amazon traffic impact
- Understand full-funnel customer journeys
- Available at no cost for brand registered sellers
Limitations:
- Data retention limited to 60 days for detailed reports
- No automated reporting or alerts
- Time-consuming manual analysis
- Difficult to compare historical trends
Third-Party Amazon Analytics Tools
Benefits of dedicated tools:
- Historical data storage beyond Amazon’s limits
- Automated alerts for performance changes
- Cross-account/cross-marketplace views
- Advanced visualization and reporting
- Time savings through automation
What to look for in an analytics tool:
- Data freshness: Real-time or near real-time updates
- Customization: Ability to create custom metrics and dashboards
- Integration: Connects with other tools in your stack
- Alerting: Proactive notifications for unusual patterns
- Export capabilities: Easy data extraction for further analysis
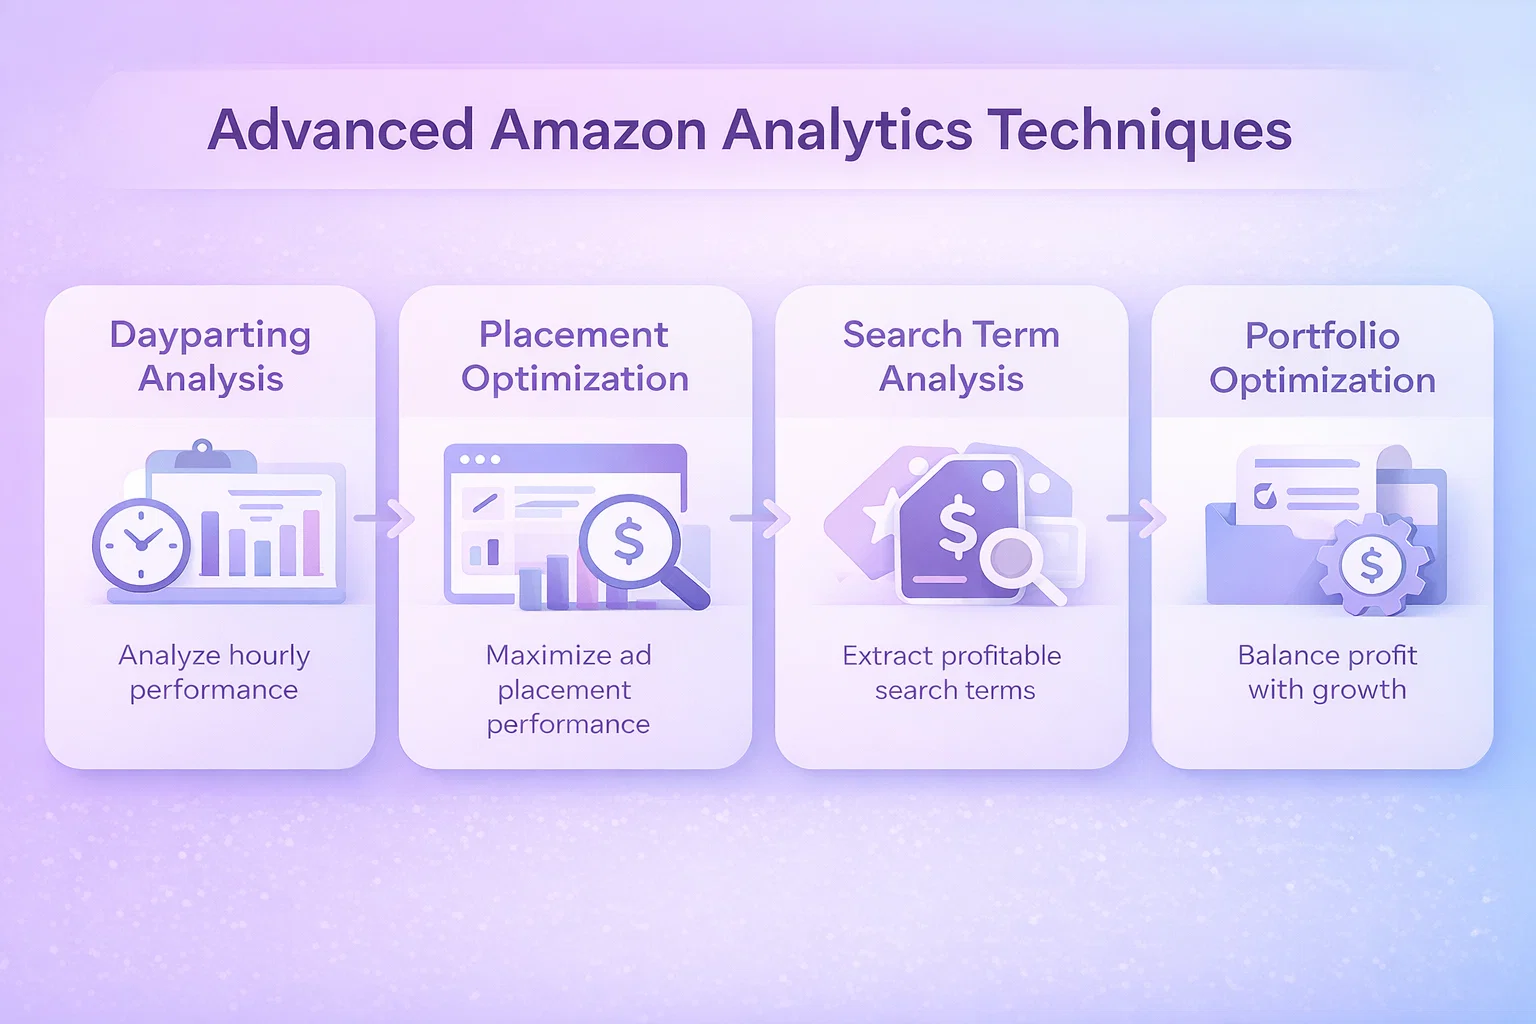
Advanced Amazon Analytics Techniques
Once you’ve mastered the basics, these advanced techniques can unlock additional performance gains.
Dayparting Analysis
Amazon’s native dayparting has limitations, but understanding hourly performance patterns still matters.
How to analyze:
- Download placement reports with hourly data
- Map conversion rates and ACoS by hour of day
- Identify high-performing time windows
- Adjust bids accordingly
Most sellers find their optimal hours cluster around:
- Morning browsing (7-9 AM)
- Lunch break shopping (12-2 PM)
- Evening prime time (7-10 PM)
Placement Performance Optimization
Not all placements convert equally. Amazon offers three placement types:
Top of Search (First Page):
- Highest visibility and CTR
- Premium CPCs
- Often worth the premium for brand visibility
Product Pages:
- Defensive placement (protecting your listings from competitors)
- Often lower CPCs
- Conversion rates vary significantly by product
Rest of Search:
- Remaining placements throughout Amazon
- Volume play with potentially lower efficiency
Search Term Analysis at Scale
The search term report is gold—but mining it manually takes forever.
Effective process:
- Aggregate search terms across 30-90 days
- Identify high-spend, low-converting terms for negative keyword additions
- Find converting search terms not explicitly targeted for keyword expansion
- Calculate search term-level profitability to optimize bids
Portfolio-Level Optimization
Sophisticated sellers think beyond individual campaigns to portfolio performance:
Portfolio approach:
- Group campaigns by product category, margin structure, or strategic priority
- Set portfolio-level ACoS targets that balance profitability with growth
- Use portfolio budgets to shift spend toward highest-opportunity areas
Common Amazon Analytics Mistakes (And How to Avoid Them)
Mistake #1: Focusing Only on ACoS
The problem: ACoS obsession can stunt growth. A product with 40% ACoS might be unprofitable now but building ranking that delivers organic sales later.
The solution: Track TACoS alongside ACoS to understand the full picture. Accept higher ACoS during launch phases with clear plans to optimize downward.
Mistake #2: Ignoring Attribution Windows
The problem: Amazon’s default reporting shows same-click attribution, but the advertising console offers 7-day, 14-day, and 30-day views.
The solution: Analyze trends across attribution windows. If 30-day ACoS is significantly lower than 7-day, your ads are driving consideration that converts later.
Mistake #3: Overlooking Organic Impact
The problem: Advertising affects organic ranking. Killing an “unprofitable” campaign might crater your organic sales.
The solution: Measure organic sales velocity before, during, and after significant campaign changes. Use holdout tests when possible.
Mistake #4: Analysis Paralysis
The problem: Spending more time analyzing than acting. Perfect analysis with no optimization wastes opportunity.
The solution: Set clear thresholds for action. If a keyword has spent 2x your target ACoS without conversion after 1,000 impressions, pause or negative it. Don’t overthink.
Amazon Analytics Checklist for Sellers
Use this checklist to audit your current analytics approach:
- I review my Amazon advertising dashboard at least twice weekly
- I track ACoS, TACoS, and ROAS consistently
- I analyze search term reports for negative keyword opportunities monthly
- I understand my conversion rates by placement type
- I have a documented process for bid optimization decisions
- I retain historical performance data beyond Amazon’s 60-day limit
- I benchmark my metrics against category standards
- I analyze hourly performance patterns for dayparting opportunities
- I track organic sales velocity alongside advertising metrics
- I have automated alerts set up for performance anomalies
Conclusion: Data-Driven Amazon Success
Amazon analytics mastery separates thriving sellers from those struggling to compete. The sellers winning in 2025 aren’t guessing—they’re measuring, analyzing, and optimizing systematically.
Start with the fundamentals: understand your ACoS, TACoS, and conversion rates. Build a consistent reporting rhythm. Then layer in advanced techniques as your sophistication grows.
Remember: analytics exist to drive action. The best dashboard in the world delivers zero value if you don’t use it to make better decisions about your Amazon advertising.
Ready to take your Amazon analytics to the next level? WisePPC helps sellers track metrics, identify optimization opportunities, and automate reporting—all in one intuitive dashboard. Learn more about WisePPC’s analytics capabilities or start your free trial today.
Last updated: March 2026
 No credit card required