Every Amazon ad metric. Every dimension. 15 months of history on day one.
Amazon's reporting layer is a patchwork. Each report exposes a narrow slice of dimensions at daily grain, capped at 90 days of lookback. Marketing Stream goes hourly but loses search terms and history. Unified Report consolidates the entire surface: every metric at campaign, ad-group, target, ad, placement, and search-term level, at hourly, daily, weekly, or monthly grain. When you join WisePPC, we backfill 15 months of daily history and 15 days of hourly history into your account before you log in for the first time.
What WisePPC unlocks that Amazon's native reporting can't
One dataset replaces eight fragmented Amazon reports — with 15 months of history loaded on day one.Every metric × every dimension × every grain
How Amazon ships data todayAmazon ships its reporting layer as fragmented slices that no single tool stitches together coherently. You end up running half a dozen separate reports, exporting to spreadsheets, and stitching them by hand for every review meeting.
15 months of history — pre-loaded when you join
What other Amazon analytics give new usersAmazon's own reports cap at 90 days of lookback. Marketing Stream offers realtime data but no historical fill. When you sign up for a new reporting platform you typically start with a blank slate and wait months for trends to emerge — by then the quarter is over.
Powered by Amazon's unified Reporting v1 API
What most reporting tools still usev2 and v3 APIs power most third-party Amazon analytics tools, but Amazon is consolidating its reporting onto a new unified Reporting v1 surface — and only v1 exposes the full metric set. Most platforms haven't integrated v1 yet.
The OLAP foundation behind every WisePPC analytics view
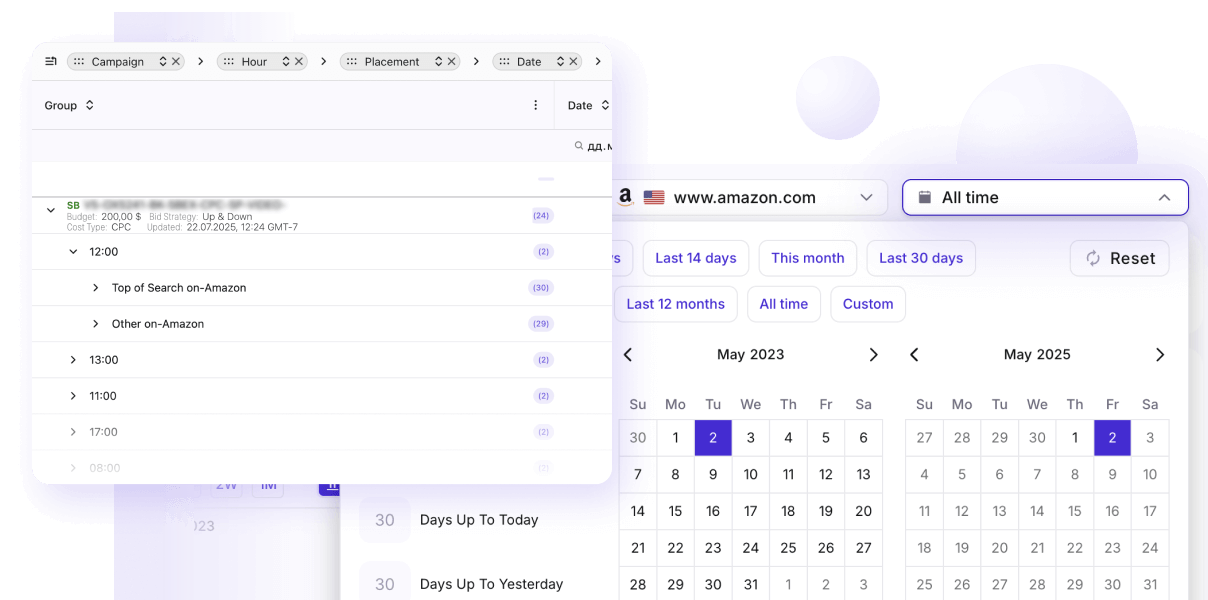
Live drill-down — not CSV marathons
Unified Report isn't a side report — it's the OLAP dataset that powers every modern analytics view in WisePPC. Adopt Unified Report and you adopt the same data layer that fuels Traffic & Conversion, Search Terms, Advanced Analytics, and every report we ship next.

What that looks like in the product:
- Saved table configurations at the top — pre-built layouts like “Product Targeting,” “Product / Campaign Type / Target,” “Search Terms by Placement,” with one-click switching and the ability to save and share new ones
- Configurable KPI tiles with sparklines and 3D / 1W / 2W / 1M trend toggles — any metric in the unified API can sit in any tile
- A multi-series time-series chart segmentable by any additional dimension (campaign type, placement, marketplace…)
- Pivot table with drag-chip dimensions — Ad Product Parent, Ad Product, Campaign Type, Campaign, Placement, Target, Date, Search Term, Match Type, Marketplace — drag chips into any sequence; the same report becomes “performance by ASIN broken down by campaign type” and “performance by search term broken down by placement” in two drag movements
- Calculated metrics live in-grid — ROAS, ACOS, CPC, CPM, VCPM, CTR, CVR, ASP, CPO — recompute on every filter change
- Per-column inline filters, color-coded performance heatmaps, group totals, and Pivot Mode — all live, no rebuild
- Multi-account and multi-marketplace context at the top — flip between client books in a click, no re-authentication, no re-stitching CSVs
- A searchable column picker exposing the full unified-API metric catalog — including the “all views” family side-by-side with the new standard metrics, so a year-over-year comparison is a checkbox, not a project
- Bulk-add negative keywords, ASINs, or audiences from any selected rows
- A live Export for when a CSV is genuinely the deliverable — but as the output of the report you've already shaped, not the only way to see the data
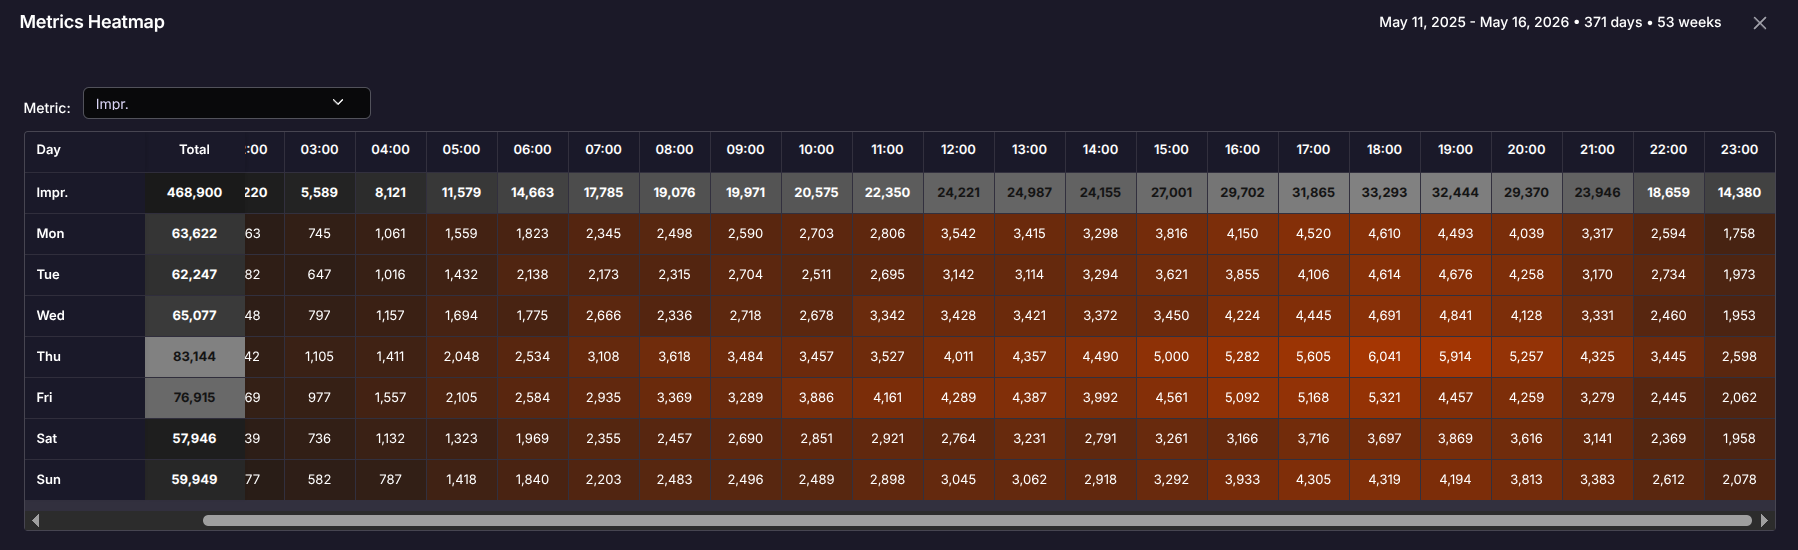
Hourly precision — for every metric, dimension, and campaign type
Dayparting decisions backed by data, not intuition
Amazon's own reports — and most analytics platforms built on them — only expose hourly granularity at the top campaign level, if at all. Unified Report goes the whole way down: every metric available at every grouping level, for every campaign type.
Available at full granularity:
- Every grouping level — campaign, ad group, ad, target, placement, search term
- Every campaign type — Sponsored Products, Sponsored Brands, Sponsored Display
- Every metric — impressions, clicks, cost, sales, units, attributed conversions, plus the full calculated set (ROAS, ACOS, CPC, CPM, VCPM, CTR, CVR, ASP, CPO)
That depth turns dayparting from a heuristic (“run more budget in the afternoon”) into a data-backed strategy: which keyword × hour combinations actually convert, when each placement peaks, how the weekend pattern diverges from weekday — visible in a single heatmap, ready to schedule against.
How Amazon ships this same data: a manual CSV marathon
Click → submit → wait → download. Repeat for every report.
Amazon does expose the unified Reporting v1 API in its own console — but as a beta “Reporting” tab that's essentially a manual report builder on top of the API. You click through hundreds of metrics and dimensions to assemble a custom report, submit the request, wait for Amazon to generate it, and then download a CSV.
It's a one-shot report builder, not a live analytics surface:
- You can't build a recurring client-facing dashboard on top of it
- You can't pivot freely once the CSV lands
- You can't join the output with the rest of your marketing data without a lot of manual plumbing
- Every reporting cycle is a fresh round of clicks, requests, waits, and reconciliation
- Multi-account and multi-marketplace work means doing the loop N times
Even motivated advertisers who know the data is there spend real time every week assembling one-off CSV exports — or simply stop bothering and work off whatever their main reporting tool shows them. The data exists. They just don't have a continuous pipe to it. Read the full technical breakdown →

Plus the 54 “all views” attribution metrics most platforms still can't see
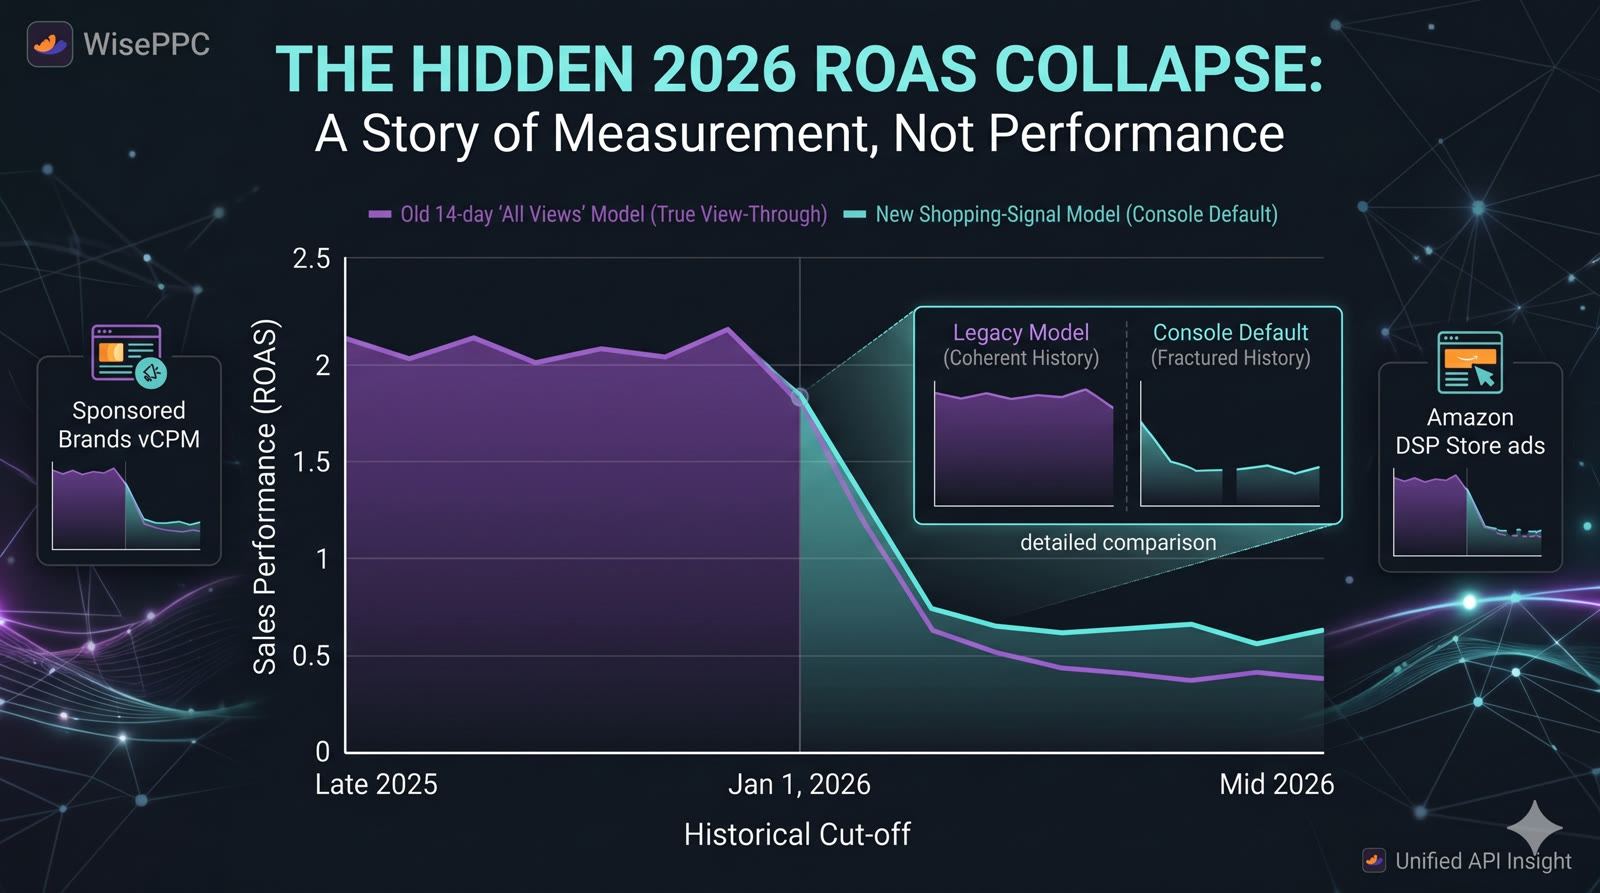
Your 2026 ROAS dropped. Your campaigns didn't.
On January 1, 2026, Amazon switched view-through credit on vCPM-billed campaigns (DSP, Sponsored Brands vCPM, Sponsored Display vCPM) to a shorter shopping-signal-enhanced model. Reported ROAS fell industry-wide. Actual campaign performance didn't change — measurement did.
Amazon preserved the legacy 14-day view-through methodology as 54 “all views” metrics — but parked them on the new unified Reporting v1 API that most third-party platforms still haven't integrated. WisePPC has. Both methodologies sit on the same row in your dashboard:
- Old-methodology ROAS (allViewsSales / cost) and new-methodology ROAS (sales / cost) — same dimensions, same time bucket, apples-to-apples
- Year-over-year decks that span the J1-2026 cutoff become coherent again
- Save a baseline view, compare other views against it
- Explain the ROAS drop to clients with data, not hand-waving
See the technical breakdown on the 2026 attribution change →
Start with 15 months of history — not a blank slate
The first week with WisePPC looks like your second year with anything else
Start Your Free 30-Day Trial Today
Start your 30-day free trial today. No credit card required. From an Amazon Ads Verified Partner you can trust.
 No credit card required 30-day free trial Access metrics Amazon Ads won't show you