Quick Summary: Finding best-selling products on Amazon involves using Amazon’s Best Sellers lists, analyzing Best Sellers Rank (BSR), leveraging Chrome extensions, and applying the Amazon magic formula: low competition + high demand + 15-25% profit margins. Free tools like Amazon Movers & Shakers, category filtering, and sales data analysis help identify winning products without expensive subscriptions.
Product selection makes or breaks Amazon selling success. With millions of products listed across hundreds of categories, identifying what actually sells feels overwhelming. The difference between profitable sellers and those who struggle often comes down to research methodology.
Most sellers waste time chasing trends without proper validation. They pick products based on guesswork rather than data. But Amazon provides free tools that reveal exactly what’s selling right now.
The platform’s Best Sellers lists update hourly. Sales rank changes tell stories about demand patterns. Review counts signal market validation. And category positioning exposes competition levels.
Here’s the thing though—knowing where to look is just the starting point. Understanding what the data means separates successful product selection from random guessing.
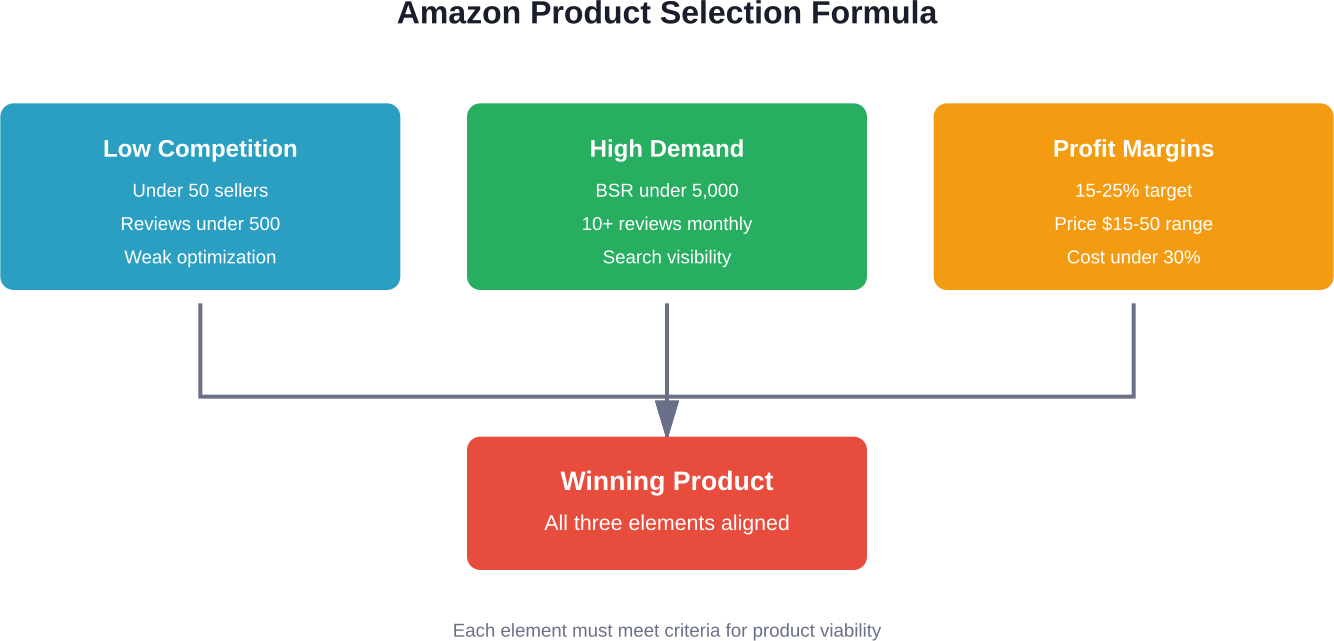
Understanding the Amazon Magic Formula
Three elements determine Amazon selling success: low competition, high demand, and profit margins between 15-25%. This combination creates the foundation for sustainable product selection.
Low competition means fewer sellers offering a specific product. High demand indicates consistent buyer interest. Healthy profit margins ensure business viability after Amazon fees, shipping costs, and other expenses.
Sound familiar? That’s because this formula works across categories. Electronics, home goods, beauty products—the principles remain consistent.
Breaking Down Low Competition
Competition analysis starts with search results. Products with fewer than 50 sellers often present opportunities. Review counts under 500 suggest markets haven’t saturated yet.
Look for listings with weak images, poor descriptions, or limited bullet points. These signals indicate sellers who haven’t optimized their presence. That creates openings for better-executed listings.
Brand dominance matters too. Categories controlled by major brands like Apple or Samsung present higher barriers. Niche products without household names offer easier entry points.
Identifying High Demand
Demand shows up in multiple ways. Best Sellers Rank below 5,000 in main categories typically indicates strong sales velocity. Products appearing on Movers & Shakers lists demonstrate rising interest.
Review velocity tells demand stories. Products gaining 10+ reviews monthly suggest active buyer engagement. Seasonal patterns reveal timing opportunities for inventory planning.
Search volume provides another demand indicator. Products appearing in autocomplete suggestions receive regular searches. Amazon’s search bar essentially functions as a free keyword research tool.
Calculating Profit Margins
Profitable Amazon selling requires mathematical discipline. Product cost should stay below 25-30% of the final sale price. This leaves room for Amazon fees (typically 15%), shipping (5-10%), and profit (15-25%).
The calculation starts with landed cost—what products cost delivered to Amazon’s warehouse. Then subtract all fees to determine net profit per unit. Monthly volume estimates convert per-unit profit into business viability assessments.
Products priced between $15-50 often hit the sweet spot. Lower prices compress margins. Higher prices increase returns and competition from established brands.
Track Amazon Advertising With WisePPC

WisePPC helps Amazon sellers analyze ad performance, keyword results, and product-level sales data in one place. It gives a clearer view of what campaigns are doing, which keywords are worth watching, and how advertising connects to product performance over time.
Need Better Visibility Into Amazon Ad Performance?
Use WisePPC to:
- analyze keyword and campaign performance
- track product sales alongside ad data
- separate paid and organic results more clearly
👉 Explore WisePPC to get a clearer view of your Amazon advertising data
![]()
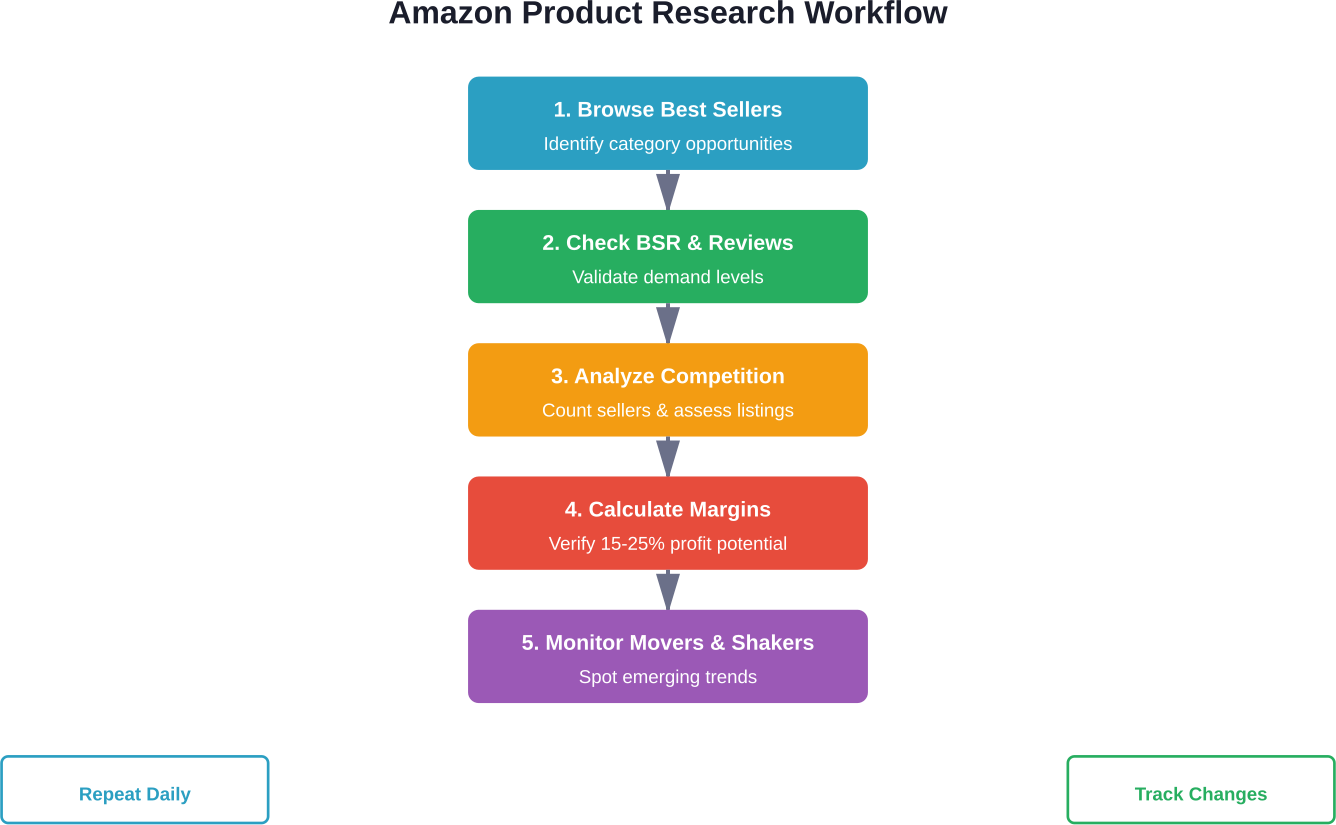
Using Amazon Best Sellers Lists
Amazon’s Best Sellers lists rank the top-performing products across every category. These lists update hourly based on recent sales data. They’re completely free and accessible without seller accounts.
Navigate to any category and look for the “Best Sellers” link. The list shows the top 100 products currently selling in that category. Each product displays its rank, price, rating, and review count.
But here’s what makes this tool powerful: the ranking changes constantly. Products moving up the list demonstrate growing momentum. Those dropping down might indicate seasonal declines or increased competition.
Category Navigation Strategy
Start with broad categories like Electronics or Home & Kitchen. According to Similarweb analysis, the top Amazon categories by sales included Electronics at $80.1 billion and Home & Kitchen at $61.8 billion. These high-volume categories offer more opportunities.
Then drill down into subcategories. Electronics contains dozens of subcategories—headphones, chargers, accessories. Each subcategory has its own Best Sellers list with 100 products.
The deeper the category, the more specific the niche. Kitchen Storage & Organization reveals different opportunities than the broad Home & Kitchen category. This granular approach uncovers hidden winners.
Reading Between the Rankings
Best Sellers Rank (BSR) appears on every product page. Lower numbers mean higher sales volume. A BSR of 500 in Electronics indicates significantly more sales than a BSR of 50,000.
But raw BSR numbers need context. Electronics categories have more competition than niche categories like Collectible Coins. A BSR of 10,000 in Collectible Coins might represent better sales than 5,000 in Electronics.
Track BSR changes over time. Products with consistently low BSR demonstrate sustained demand. Those with volatile rankings might indicate one-time viral spikes rather than stable markets.
Review Count Analysis
Review counts validate market demand. Products with thousands of reviews prove buyers purchase and engage with them. In Q2 2025, the Essence Lash Princess False Lash Effect Mascara was the most reviewed product among the top ten best-selling beauty and personal care items on Amazon.
Look for the ratio between reviews and sales rank. High-ranked products with relatively few reviews suggest newer listings gaining traction. This timing presents opportunities before markets saturate.
Review velocity matters more than total count. Products gaining reviews rapidly demonstrate current buyer interest. Stagnant review counts might signal declining sales despite good BSR history.
Leveraging Best Sellers Rank Data
BSR functions as Amazon’s internal sales performance metric. Every product in every category receives a rank based on recent and historical sales. The system updates hourly to reflect current performance.
Understanding BSR interpretation transforms it from a simple number into actionable intelligence. Different categories have different volume expectations. Different BSR levels indicate different sales velocities.
BSR Benchmarks by Category
Main category BSR provides the broadest sales indicator. Products ranked below 5,000 in main categories typically sell multiple units daily. Those ranked below 1,000 often sell dozens or hundreds daily.
Subcategory BSR shows niche dominance. A product might rank 15,000 in Toys & Games but rank 5 in Educational Building Blocks. The subcategory rank reveals strong performance in a specific market segment.
Track both rankings. Main category BSR indicates overall performance. Subcategory BSR reveals niche positioning opportunities.
| BSR Range | Sales Velocity | Competition Level | Opportunity Assessment |
|---|---|---|---|
| 1-100 | Very High (100+ daily) | Intense | Established market leaders |
| 101-1,000 | High (20-100 daily) | Strong | Proven demand, tough entry |
| 1,001-5,000 | Moderate (5-20 daily) | Moderate | Good opportunity zone |
| 5,001-20,000 | Low-Moderate (1-5 daily) | Lower | Niche opportunities |
| 20,001+ | Low (Occasional sales) | Minimal | High risk, low validation |
Using BSR for Sales Estimation
BSR correlates with approximate sales volume. Third-party tools convert BSR into daily sales estimates. While not perfectly accurate, these estimates guide inventory and viability decisions.
Generally speaking, lower BSR means exponentially higher sales. The relationship isn’t linear—a product ranked 100 sells far more than twice what a product ranked 200 sells.
Category size affects the BSR-to-sales relationship. Large categories like Books or Electronics require higher sales volume to achieve low BSR. Smaller categories need fewer sales for comparable rankings.
Exploring Amazon Movers & Shakers
The Movers & Shakers list tracks products with the biggest BSR gains in the past 24 hours. This tool reveals emerging trends before they fully materialize. Products appearing here demonstrate rapid momentum.
Access Movers & Shakers through the main menu or by adding “/gp/movers-and-shakers” to Amazon’s URL. Like Best Sellers, it breaks down by category with rankings and percentage gains.
Now, this is where it gets interesting. Products on Movers & Shakers might not have the best absolute BSR. But they’re gaining ground fast. That indicates shifting buyer interest or successful marketing launches.
Identifying Trend Patterns
Seasonal products often dominate Movers & Shakers during their peak periods. Beach toys spike in spring. Halloween costumes explode in September. Holiday decorations climb in November.
But look for non-seasonal movers too. These indicate genuine trend shifts or viral product discovery. A phone accessory climbing 5,000 positions in 24 hours suggests social media buzz or influencer promotion.
Track Movers & Shakers daily for a week. Products appearing repeatedly demonstrate sustained momentum rather than one-day flukes. Consistency validates trend strength.
Timing Entry Points
Early trend identification creates competitive advantages. Products just starting to climb haven’t attracted heavy competition yet. Their review counts stay relatively low. Seller counts remain manageable.
That said, being too early carries risk. Some trends fizzle quickly. Validation through multiple data points—sustained ranking improvements, growing review velocity, increasing seller interest—reduces risk.
Products moving from obscurity (BSR 100,000+) to moderate visibility (BSR 10,000-20,000) present sweet spots. They’ve demonstrated initial traction without full market saturation.
Chrome Extensions and Research Tools
Browser extensions overlay Amazon pages with additional data. Sales estimates, profit calculators, historical BSR tracking, and competition metrics appear directly on product pages.
Many sellers mention these tools in community discussions. They transform product research from manual data collection into streamlined analysis. The right extensions reveal insights hidden in Amazon’s standard interface.
Free Extension Options
Several extensions offer free tiers with basic functionality. These typically show BSR, review counts, seller counts, and simple profit calculations. No subscription required for core features.
Install extensions cautiously. Review privacy policies and permissions. Reputable tools request only necessary access. Avoid extensions requiring excessive browser permissions.
Test multiple extensions to find the best fit. Different tools emphasize different metrics. Some focus on profitability. Others prioritize competition analysis or historical tracking.
Data Points to Track
Effective extensions display seller count directly on listings. High seller counts (50+) indicate competitive markets. Low counts (under 20) suggest opportunity gaps.
Historical BSR graphs reveal sales patterns. Seasonal products show clear peaks and valleys. Year-round products maintain relatively stable BSR. This context informs inventory planning and risk assessment.
Price history tracking exposes competitive dynamics. Frequently changing prices might indicate price wars. Stable pricing suggests healthy margins and established market positioning.
Manual Search Techniques
Amazon’s search bar doubles as a market research tool. Autocomplete suggestions reveal actual customer searches. The order of suggestions indicates search volume—more popular terms appear first.
Type a broad keyword like “kitchen” and watch the suggestions. “kitchen towels”, “kitchen organizer”, “kitchen gadgets”—each represents real buyer search behavior. These terms guide product category exploration.
Search results themselves contain intelligence. The first page shows Amazon’s algorithm’s best guess at what buyers want. Products appearing here have strong relevance signals and sales velocity.
Analyzing Search Results
Standard Amazon search shows 48 products per page across two pages of default results. But the search bar reveals thousands of available results. Most sellers never look past page one.
Scroll through multiple pages. Products on pages 3-5 often have decent demand but face less competition for visibility. They represent opportunities for better optimization and marketing.
Note which products appear with “Amazon’s Choice” or “Best Seller” badges. These designations indicate algorithm favoritism based on performance metrics. Understanding what earns these badges guides listing optimization.
Search Term Variations
Test different keyword variations. “phone holder” versus “phone mount” versus “phone stand”—each might reveal different products and competition levels. Buyers use varied terminology for the same solutions.
Long-tail searches (3-4+ words) show more specific buyer intent. “magnetic phone holder car vent” indicates a buyer who knows exactly what they want. Products ranking for specific long-tail terms often face less competition.
Seasonal variations matter too. Search “Halloween” in January versus September. The product mix changes dramatically. This timing intelligence informs inventory planning and listing preparation.
Profitable Categories to Explore
A 2024 Statista survey found that beauty and personal care, along with home and kitchen, ranked among the most profitable categories for Amazon sellers worldwide. These categories combine strong demand with manageable entry barriers.
Statista data from Q2 2025 indicated that skincare items represented a significant portion of the top 25 beauty and personal care best-sellers on Amazon. This category concentration suggests opportunities within specific subcategories rather than entire broad categories.
Home and Kitchen
Home and Kitchen generated $61.8 billion in Amazon sales according to Similarweb analysis. The category’s breadth—from cookware to organization to decor—creates countless subcategory opportunities.
Organization products perform particularly well. Storage containers, closet systems, drawer dividers—items solving common household problems see consistent demand. These products often have lower return rates than electronics or apparel.
Kitchen gadgets under $25 hit the pricing sweet spot. They’re impulse-friendly while maintaining decent profit margins. Many kitchen tools solve specific problems, creating opportunities for differentiation.
Beauty and Personal Care
Beauty products benefit from repeat purchases. Consumables like mascara, moisturizers, and cleansers create ongoing revenue streams. The Essence Lash Princess Mascara’s dominance in best-sellers demonstrates this category’s potential.
Private label opportunities exist for commodity beauty items. Generic makeup brushes, nail tools, and hair accessories allow brand building without complex formulations. Bundling strategies work well here too.
But watch for FDA regulations with skincare claims. Products making medical or therapeutic claims face additional compliance requirements. Stick to cosmetic claims for simpler market entry.
Tools and Home Improvement
Tools & Home Improvement reached $30.8 billion in Amazon sales. The category attracts buyers with specific project needs and high purchase intent. They’re often willing to pay premium prices for the right solutions.
Specialized tools for specific tasks often face less competition than general-purpose tools. A tile leveling system serves a narrow market but faces fewer direct competitors than standard screwdriver sets.
Accessories and consumables complement major tool purchases. Drill bits, saw blades, sandpaper—these items get replaced regularly. They pair well with higher-priced primary tools customers already own.
Validating Product Ideas
Data collection means nothing without proper validation. Multiple signals should align before committing to a product. Single indicators create false confidence.
Cross-reference Best Sellers rank, review counts, seller counts, and price points. Products scoring well across all metrics demonstrate genuine opportunities. Those excelling in one area but failing others present risks.
The Review Count Test
Compare top-selling products’ review counts within a category. If the top 10 products all have 1,000+ reviews, breaking in requires significant effort. If they have 100-300 reviews, opportunities remain.
But here’s the thing—don’t automatically avoid high-review categories. Sometimes strong review counts indicate active buyer engagement and high conversion rates. The market size might support additional sellers.
Look for review count gaps. If positions 1-3 have 2,000+ reviews but positions 4-10 have under 500, those lower positions might be vulnerable. Better products could displace them.
Price Point Analysis
Study the price range of best-sellers in target categories. Most products should cluster around a specific range. Outliers either fill specialty niches or struggle against market expectations.
Calculate your costs against prevailing prices. If competitors sell at $19.99 and the math doesn’t work at that price, the product won’t work. Markets resist significant price premiums without clear differentiation.
Test pricing assumptions with landed costs, Amazon fees, advertising costs (estimate 10-15% of revenue), and desired profit margins. If the numbers don’t hit 15% net profit, keep searching.
| Validation Metric | Green Light Signal | Yellow Flag Signal | Red Flag Signal |
|---|---|---|---|
| BSR Main Category | Under 5,000 | 5,000-20,000 | Over 50,000 |
| Number of Sellers | Under 20 | 20-50 | Over 100 |
| Review Count (Top 3) | Under 500 | 500-1,500 | Over 3,000 |
| Review Velocity | 5-15 monthly | 1-4 monthly | Under 1 monthly |
| Profit Margin | Over 20% | 15-20% | Under 15% |
| Price Range | $15-50 | $10-15 or $50-75 | Under $10 or over $75 |
Common Research Mistakes
Sellers repeatedly make predictable errors in product research. These mistakes waste time and capital. Recognizing them prevents costly learning experiences.
Chasing Saturated Markets
Phone cases, fidget spinners, generic supplements—these categories attract waves of sellers. High demand tempts entry, but massive competition crushes margins. Breaking through requires substantial capital and expertise.
Some sellers in community forums report extended product research periods and mention purchasing courses and software without immediate success. The problem often isn’t the tools—it’s targeting oversaturated categories.
Look for boring, unsexy products. The most profitable items rarely generate excitement. They solve mundane problems consistently. Flashy trending products attract competition. Practical solutions sustain businesses.
Ignoring Seasonality
Pool floats sell great in summer. Holiday decorations peak in November. But seasonal products create inventory management challenges. Unsold seasonal stock becomes dead capital for months.
Track BSR patterns over 12 months when possible. Historical data reveals seasonal fluctuations. Chrome extensions with historical tracking make this analysis easier. Stable year-round BSR indicates consistent demand.
Seasonal products can work with proper planning. But they require careful inventory management and alternative product pipelines for off-seasons. New sellers often lack the capital to weather seasonal downturns.
Overlooking Competition Quality
Twenty sellers doesn’t automatically mean high competition. Five excellent sellers with optimized listings, professional photography, and strong reviews create more competition than 20 mediocre sellers with poor execution.
Evaluate competitor listing quality. Poor images, sparse descriptions, and weak bullet points indicate vulnerable positions. These sellers haven’t invested in optimization. Better execution creates competitive advantages.
Review competitor review profiles. Consistent 4.5+ star ratings with hundreds of reviews indicate customer satisfaction. Multiple sellers maintaining strong reviews suggests limited differentiation opportunities. Look for categories where leading sellers have 3.5-4.0 ratings—improvement opportunities exist.
Scaling Your Research Process
Product research shouldn’t stop after finding one product. Successful sellers maintain ongoing research pipelines. They continuously evaluate new opportunities while managing existing products.
Set research time blocks. Dedicate specific hours weekly to category exploration, BSR tracking, and trend monitoring. Consistency generates more results than sporadic intensive sessions.
Building a Product Database
Track potential products in spreadsheets or databases. Record BSR, price, review counts, seller counts, and profit calculations. Update these metrics weekly to spot changes.
This database becomes a pipeline of validated opportunities. When ready to expand, pre-researched products accelerate launches. The database also reveals category trends and seasonal patterns over time.
Include rejected products with rejection reasons. This prevents researching the same products multiple times. Documentation saves time and reveals market knowledge accumulation.
Monitoring Market Changes
Markets shift constantly. New competitors enter. Existing sellers exit. Consumer preferences evolve. Yesterday’s research becomes outdated quickly.
Re-validate existing product ideas quarterly. Check if BSR, competition, and pricing dynamics changed. Products that didn’t work six months ago might work now. Previously viable products might have deteriorated.
Subscribe to category-specific Best Sellers lists if Amazon offers email notifications. Track Movers & Shakers in target categories daily. These habits build market intuition that accelerates research efficiency.
Frequently Asked Questions
What is the best way to find profitable products on Amazon?
The most effective approach combines Amazon’s free Best Sellers lists with BSR analysis and the magic formula: low competition (under 50 sellers), high demand (BSR under 5,000), and 15-25% profit margins. Start by browsing Best Sellers in categories matching your interests, then drill down into subcategories. Analyze BSR trends, review counts, and seller numbers for each promising product. Validate findings by checking Movers & Shakers for momentum signals and calculating actual profit margins after all fees.
How accurate is Best Sellers Rank for estimating sales?
BSR provides directional guidance rather than precise sales figures. While BSR correlates with sales velocity—lower numbers mean higher sales—the relationship varies by category size and competitiveness. Large categories like Electronics require more sales volume to achieve low BSR than smaller categories. Third-party tools convert BSR to sales estimates, but these remain approximations. Use BSR for comparative analysis within categories rather than absolute sales predictions. Track BSR changes over time to understand demand trends.
Can you find winning products without paying for research tools?
Absolutely. Amazon provides extensive free data through Best Sellers lists, Movers & Shakers, search results, and on-page BSR. The search bar’s autocomplete function reveals actual customer search terms. Review counts and ratings appear on all listings. Basic profit calculations work with manual cost research and Amazon’s fee calculator. Many successful sellers started with only free tools. Paid tools accelerate research but aren’t required for finding viable products. Consistent manual research builds market knowledge that software can’t replace.
What product categories are most profitable for new sellers?
According to 2024 data, beauty and personal care alongside home and kitchen ranked among the most profitable categories for sellers worldwide. Home organization, kitchen gadgets under $25, and consumable beauty items offer manageable entry points. These categories balance sufficient demand with reasonable competition levels. Look for boring, practical products rather than trendy items. Specialized tools for specific tasks often face less competition than general-purpose products. The most profitable category varies by individual research, sourcing capabilities, and execution quality.
How many competitors indicate too much competition?
Generally speaking, products with over 50 active sellers present challenging markets for new entrants. However, seller count alone doesn’t determine opportunity. Evaluate competitor quality—five excellent sellers with optimized listings create more competition than 20 poor-quality listings. Products with 15-30 sellers and mediocre listing quality often present sweet spots. These markets demonstrate demand validation without overwhelming competition. Competition assessment requires examining seller count, listing quality, review profiles, and brand strength together.
Should I avoid seasonal products as a new seller?
Seasonal products create specific challenges for beginners. They require capital sitting idle during off-seasons and careful inventory timing. However, they can work with proper planning and sufficient capital reserves. The key is understanding seasonal patterns through 12-month BSR tracking. Products with mild seasonality—20-30% sales fluctuation—present less risk than extreme seasonal items like holiday decorations. New sellers often find success with year-round products first, then add seasonal items once cash flow stabilizes.
How often should I update my product research?
Active product research should happen weekly for sellers building pipelines. Track Best Sellers and Movers & Shakers in target categories to spot emerging trends and market shifts. Re-validate specific product ideas quarterly, checking for BSR changes, competition increases, and pricing dynamics. Markets evolve rapidly—yesterday’s opportunity may saturate quickly. Maintaining regular research habits builds market intuition and ensures a consistent pipeline of validated products ready when you’re prepared to launch.
Taking Action on Research Findings
Research without execution generates no revenue. The gap between analysis and action separates successful sellers from perpetual researchers. Perfection doesn’t exist in product selection—calculated risks do.
Start with one product meeting the magic formula criteria. Source samples. Test the market with small inventory orders. Validate assumptions with real sales data rather than endless research.
But wait. Don’t rush into the first product that looks decent. Validate at least 10-15 products thoroughly before selecting finalists. This comparison reveals relative strengths and weaknesses invisible when analyzing products in isolation.
Build systems for ongoing research alongside active selling. The best product today might face heavy competition next quarter. Pipeline development ensures business continuity and growth opportunities.
Amazon selling success combines systematic research, calculated risk-taking, and continuous optimization. The tools exist. The data’s available. Now execution determines outcomes.
The marketplace rewards those who identify opportunities others miss, enter with better execution than existing competitors, and maintain the discipline to track metrics and adapt. Product research isn’t a one-time event—it’s an ongoing discipline that separates sustainable Amazon businesses from short-lived experiments.
 No credit card required