Quick Summary: Amazon India’s best-selling products in 2026 span quick commerce groceries, fashion, electronics, beauty, and health supplements. Categories like vegan protein powders, athleisure, phone accessories, and wellness items dominate search trends with 10-58% growth. Understanding these trending products and leveraging Amazon’s marketplace tools helps sellers tap into India’s US$ 163 billion e-commerce opportunity projected for 2026.
India’s e-commerce landscape continues reshaping how millions shop, and Amazon India sits at the center of this transformation. With over 168 million products across countless categories, identifying what’s actually selling—and what’s just noise—matters more than ever.
According to IBEF, Indian e-commerce is expected to grow at a compound annual growth rate (CAGR) of 27% to reach US$ 163 billion by 2026. That’s substantial opportunity. But it also means competition intensifies daily.
Here’s the thing though—not all product categories grow equally. Some segments explode with 50%+ annual growth while others stagnate. Understanding these patterns separates successful sellers from those burning through inventory capital.
The Quick Commerce Revolution Reshaping Best Sellers
Quick commerce fundamentally changed what products dominate Amazon India’s bestseller lists. Deliveries arriving in 10 minutes to 2 hours—versus the traditional 1-7 days—shifted consumer expectations completely.
Quick commerce now handles over two-thirds of e-grocery orders in India. That’s not a marginal shift. That’s category domination.
This delivery speed expansion into electronics and fashion created new bestseller opportunities. Products that previously required showroom visits now sell instantly online because customers trust they’ll arrive within hours, not days.
The rapid delivery model particularly benefits specific product types:
- Daily essentials and groceries (staples, snacks, personal care)
- Last-minute fashion accessories (phone cases, socks, small electronics)
- Health supplements and wellness products
- Beauty and cosmetics items
Real talk: if your product fits these categories and you’re not optimizing for quick commerce visibility, you’re leaving money on the table.
Know Which Products Are Pulling Results
Not every product contributes equally to revenue. WisePPC helps break down performance at the product and campaign level, making it easier to see where results come from and where performance drops.
Want to Understand Product Performance?
- track ad spend alongside actual sales
- analyze campaign and keyword performance
- identify what drives revenue
👉 Explore WisePPC to understand your Amazon advertising data.
![]()
Top Product Categories Driving Amazon India Sales in 2026
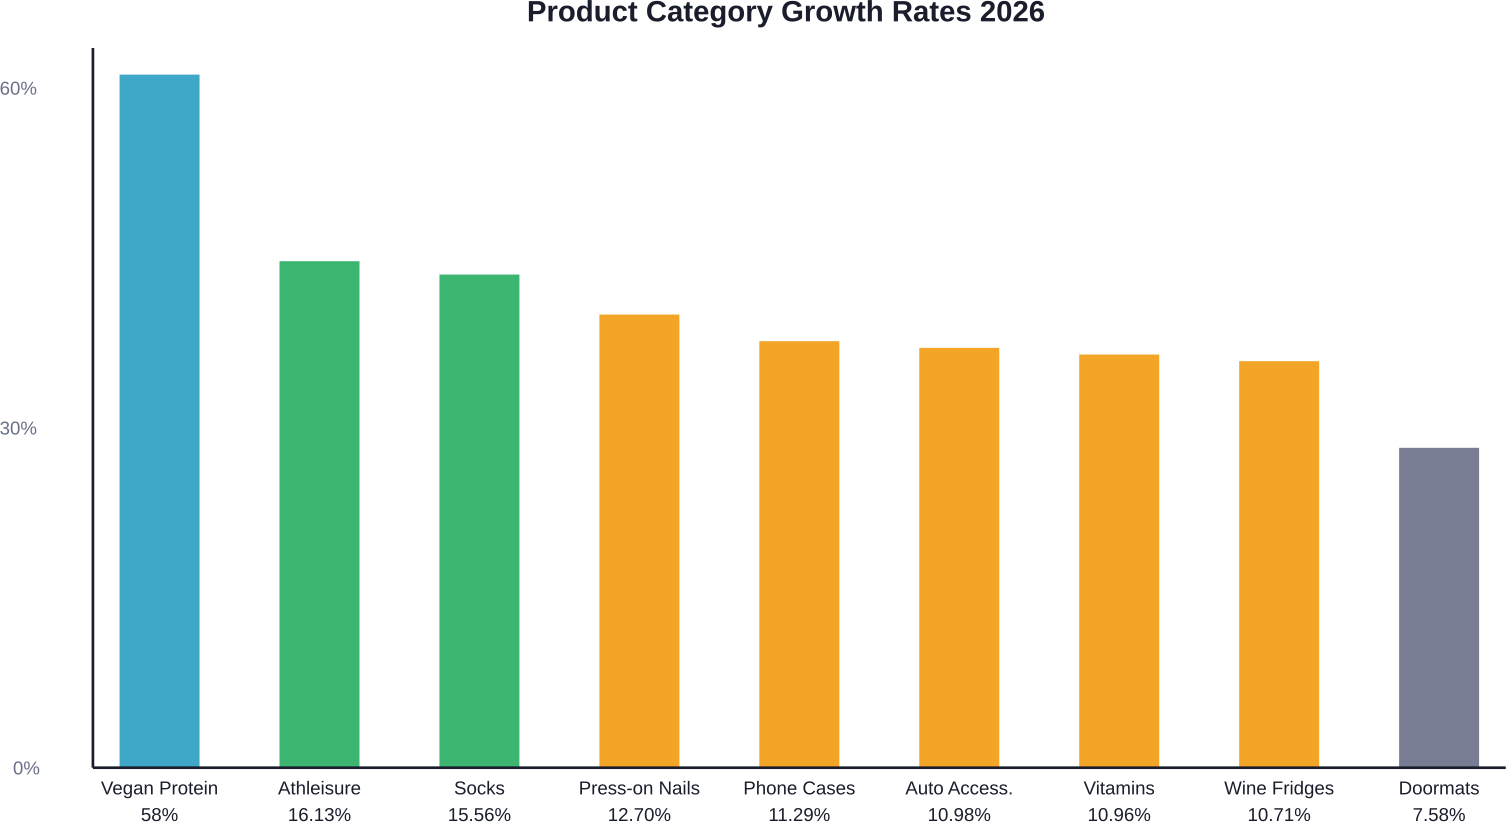
Data from search growth trends and marketplace analysis reveals clear winners. These categories show consistent growth and high consumer demand across India’s diverse market.
Health and Wellness: The 58% Growth Leader
Vegan protein powder leads all product categories with 58% global search growth. That’s not just a trend—that’s a fundamental shift in consumer priorities.
The wellness category encompasses several high-performing niches:
- Plant-based protein supplements (vegan powders, pea protein)
- Vitamins and supplements (10.96% growth)
- Fitness accessories and equipment
- Organic and health-focused food items
Health consciousness among Indian consumers accelerated dramatically post-pandemic and shows no signs of slowing. Sellers focusing on authentic, quality wellness products find receptive audiences willing to pay premium prices.
Fashion and Accessories: Consistent Volume Drivers
Fashion consistently ranks among most-selling products on Amazon India, but specific subcategories outperform dramatically.
Athleisure leads fashion growth at 16.13%, reflecting India’s increasing fitness culture and work-from-home comfort preferences. The category blends functionality with style—exactly what modern consumers want.
Other fashion bestsellers include:
- Socks (15.56% growth—yes, really)
- Press-on nails (12.70% growth)
- Traditional and fusion wear
- Sustainable and eco-friendly apparel
Fashion’s advantage? Repeat purchases. Unlike electronics, customers buy new clothing regularly, creating sustainable revenue streams for sellers.
Electronics and Accessories: Beyond Basic Gadgets
Phone cases show 11.29% growth, representing the broader accessories boom. With smartphone penetration exceeding 60% in urban India and growing rapidly in rural markets, accessories create ongoing opportunity.
Auto accessories similarly demonstrate 10.98% growth as vehicle ownership expands and consumers personalize their cars.
Wine fridges (10.71% growth) represent the premiumization trend—consumers investing in specialized appliances for lifestyle enhancement rather than just basic functionality.
Beauty and Personal Care: Fast-Growing Segment
Beauty emerges as one of the fastest-growing categories on Amazon India. The segment benefits from both premiumization and mass-market expansion simultaneously.
Urban consumers trade up to premium brands and specialized products while tier-2 and tier-3 cities embrace branded beauty products for the first time through e-commerce access.
Press-on nails specifically show 12.70% growth, representing the broader DIY beauty trend. Consumers want salon-quality results at home convenience.
Home and Lifestyle Products
Doormats show 7.58% growth—seemingly mundane but representing the massive home improvement and décor market. Indians increasingly invest in home aesthetics, creating steady demand for affordable upgrade items.
Wine fridges and specialized appliances indicate premiumization within home categories. Consumers don’t just want functional homes; they want curated lifestyle spaces.
Geographic Markets Unlocking New Opportunities
Rural markets unlock entirely new trending product categories on Amazon India. As internet penetration reaches smaller towns and villages, purchase patterns differ dramatically from urban metros.
IBEF data shows India’s Direct-to-Consumer (D2C) segment projected to grow at 40% CAGR, reaching US$ 60 billion by 2027. Much of this growth concentrates in tier-2, tier-3, and rural markets accessing branded products through e-commerce for the first time.
Products performing exceptionally well in rural markets include:
- Agricultural tools and equipment
- Solar-powered devices and lighting
- Educational materials and books
- Basic electronics (phones, chargers, speakers)
- Personal care and hygiene products
The rural opportunity represents greenfield territory. Less competition, eager customers, and growing purchasing power create favorable conditions for sellers willing to understand these markets.
How Amazon’s Ranking System Actually Works
Understanding what sells matters, but understanding how Amazon determines bestseller rankings matters equally for sellers.
Amazon’s Best Sellers Rank (BSR) updates hourly based on recent sales and historical sales data. Products don’t need massive volume to rank—they need consistent velocity relative to their category.
According to Amazon Seller Central guidance, proper product categorization and browse nodes directly impact ranking visibility. Sellers with correct categorization but missing BSR often face technical indexing issues rather than sales problems.
Key ranking factors include:
- Recent sales velocity (weighted toward last 24-72 hours)
- Historical sales patterns
- Product category and browse node assignment
- Keyword optimization and relevance
- Customer reviews and ratings
- Pricing competitiveness
The #1 New Release badge operates differently—typically appearing within 30-90 days of launch for products showing strong early traction. According to seller experiences shared in Seller Central, the #1 New Release badge can appear and disappear based on sales performance, with some sellers reporting thresholds around rank 45,000 in office products.
Optimizing Product Listings for Amazon India’s Search
Amazon SEO differs fundamentally from Google SEO, though both aim at visibility. Amazon’s A9 algorithm prioritizes conversion-focused signals over traditional link-based authority.
According to official Amazon Seller Central guidance published in November 2025, seven core strategies improve search rankings:
| Strategy | Impact Level | Implementation Difficulty |
|---|---|---|
| Keyword-optimized titles | High | Low |
| Backend search terms | High | Low |
| Competitive pricing | Very High | Medium |
| High-quality images | High | Medium |
| Enhanced descriptions | Medium | Low |
| Positive reviews | Very High | High |
| Inventory availability | Critical | Medium |
Pricing adjustment alone can dramatically shift ranking. Amazon’s algorithm favors competitively priced products because they convert better, which ultimately serves Amazon’s business model.
Product titles should include primary keywords naturally within the first 80 characters—that’s what displays in mobile search results where most browsing happens.
Backend search terms allow 250 bytes of hidden keywords. Use this space for spelling variations, alternate names, and related terms that don’t fit naturally in visible content. Don’t repeat keywords already in titles or descriptions.
Using Amazon’s Product Opportunity Explorer
Amazon provides sellers with Product Opportunity Explorer—a powerful tool for identifying high-demand, low-competition products worth selling.
The tool filters products by growth rate, making it easy to spot items with 20%+ growth over the past three months. That’s the trending product sweet spot—proven demand with room for new sellers.
Search volume, click share, and conversion rate data help evaluate opportunity quality. High search volume means customer interest exists. Low click share on top results means current listings don’t satisfy search intent well. That’s your opening.
But wait. Not everyone has access to all Product Opportunity Explorer features. Availability depends on seller account type and market participation level.
Market Sizing: India’s E-Commerce Opportunity in Numbers
Context matters when evaluating product opportunities. Understanding market size helps set realistic expectations and investment levels.
According to IBEF, India’s Business-to-Business (B2B) online marketplace represents a US$ 200 billion opportunity by 2030. That’s separate from the consumer e-commerce market, creating dual opportunities for sellers who can serve both segments.
The consumer e-commerce market growing at 27% CAGR reaches US$ 163 billion by 2026—that’s this year. Amazon India captures significant market share alongside Flipkart and emerging quick commerce platforms.
The D2C segment growing at 40% CAGR deserves special attention. Brands bypassing traditional retail and selling directly through platforms like Amazon capture higher margins while building direct customer relationships.
Common Pitfalls Sellers Face
Community discussions reveal consistent challenges sellers encounter when pursuing bestseller rankings on Amazon India.
Organic rank loss happens suddenly and mysteriously. Sellers report best-performing ASINs losing all organic keyword rankings overnight despite unchanged inventory, pricing, and listing content. Traffic shifts entirely to sponsored products.
According to seller experiences shared in community forums, reaching out to Seller Support often yields generic troubleshooting responses rather than resolution. The issue typically stems from algorithm adjustments or competitive dynamics rather than listing problems.
BSR disappearing from listings frustrates sellers who know their products sell well. Proper category and browse node assignment matters critically, but sometimes BSR visibility requires crossing minimum sales thresholds within specific timeframes.
Inventory management determines ranking sustainability. Stockouts devastate BSR because Amazon’s algorithm interprets unavailability as unpopularity. Rankings don’t simply resume when inventory returns—rebuilding momentum takes weeks.
Practical Steps for Sellers Starting Today
So what should sellers actually do with this information? Here’s the practical playbook.
Start by researching growth categories aligned with your capabilities and capital. Vegan protein powder shows massive growth, but requires certifications, quality sourcing, and potentially larger investment than phone cases or socks.
Use Product Opportunity Explorer to validate specific products within chosen categories. Look for 20%+ growth, decent search volume, and conversion rates suggesting satisfied customers don’t exist in abundance yet.
Optimize listings thoroughly before launch. Keyword research, compelling titles, professional images, and complete backend search terms aren’t optional—they’re baseline requirements in competitive categories.
Price competitively from day one. Sellers generally cannot out-rank established competitors while charging 20% more unless their product demonstrates clear differentiation.
Plan inventory carefully. Running out of stock doesn’t just pause sales—it destroys rankings you worked hard to build.
Monitor ranking performance weekly, not daily. Rankings fluctuate constantly. Weekly trends reveal actual trajectory versus noise.
Frequently Asked Questions
What are the most selling products on Amazon India right now?
Health and wellness products lead current sales, particularly vegan protein powders (58% growth), vitamins and supplements (10.96% growth). Fashion categories show strong performance with athleisure (16.13% growth) and accessories. Quick commerce groceries dominate volume sales, handling over two-thirds of e-grocery orders.
How does Amazon calculate Best Sellers Rank in India?
Amazon updates BSR hourly based on recent sales velocity (weighted toward the last 24-72 hours) and historical sales patterns. Rankings are category-specific, so a product can rank differently across multiple categories. Proper categorization and browse node assignment directly impact ranking visibility and calculation.
Can new sellers compete with established bestsellers on Amazon India?
Yes, particularly in high-growth categories with 20%+ annual expansion. New sellers succeed by targeting specific niches, optimizing listings thoroughly, pricing competitively, and maintaining consistent inventory. Product Opportunity Explorer helps identify categories with customer demand exceeding current seller supply.
Which product categories work best in rural Indian markets?
Agricultural tools, solar-powered devices, educational materials, basic electronics, and personal care products perform exceptionally well in tier-2, tier-3, and rural markets. These areas access branded products through e-commerce for the first time, creating greenfield opportunity with less competition than urban metros.
How important is quick commerce for Amazon India sellers?
Extremely important for specific categories. Quick commerce handles over two-thirds of e-grocery orders and expands rapidly into electronics and fashion. Products fitting the quick commerce model (daily essentials, last-minute accessories, wellness items, beauty products) benefit from changed consumer expectations around delivery speed.
What’s the difference between trending products and sustainable bestsellers?
Trending products show high short-term growth but may not sustain demand long-term. Sustainable bestsellers demonstrate consistent sales velocity over months or years, typically in categories with recurring purchase patterns like groceries, health supplements, or personal care. The best opportunities combine current growth trends with long-term category fundamentals.
How much should sellers invest in advertising on Amazon India?
Community experiences suggest $2,000+ initial investment for competitive categories, though requirements vary significantly by product type and competition level. Sponsored Products become essential when organic rankings don’t develop quickly. Budget 20-30% of expected revenue for advertising during launch phases, scaling down as organic rankings improve.
Taking Action in India’s E-Commerce Boom
Amazon India’s marketplace presents genuine opportunity, but success requires understanding what actually sells versus what sounds appealing. The data shows clear winners: health and wellness leading at 58% growth, fashion accessories maintaining steady volume, and quick commerce transforming customer expectations across categories.
The US$ 163 billion e-commerce market growing at 27% CAGR means room exists for new sellers. But room doesn’t guarantee success. Product selection, listing optimization, competitive pricing, and inventory management separate profitable sellers from those struggling to gain traction.
Start with categories showing proven growth and demand that exceeds current supply. Use Amazon’s tools like Product Opportunity Explorer to validate ideas with data rather than intuition. Optimize every element of your listings because tiny improvements compound across thousands of views.
The Indian e-commerce boom isn’t slowing. The question isn’t whether opportunity exists—it’s whether execution will be strong enough to capture it. Which product category presents the strongest opportunity for research?
 No credit card required