Drive FBA Sales with Dashboard Analytics (2026 Guide)
Quick Summary: The FBA Dashboard provides powerful analytics tools including Product Performance Spotlight, Returns & Recovery Insights, and Voice of the Customer metrics that directly impact sales. By leveraging proactive alerts, monitoring 30+ ASIN-level metrics, and acting on performance trends, sellers can identify issues faster, optimize listings, and recover sales opportunities before they’re lost.
Amazon’s FBA Dashboard has evolved into something sellers can’t afford to ignore. But here’s the thing—most sellers barely scratch the surface of what these analytics tools can actually do for sales performance.
The difference between struggling and thriving often comes down to how sellers use the data sitting right in front of them. Amazon provides multiple dashboard tools specifically designed to help FBA sellers identify problems, spot opportunities, and act before competitors do.
This guide breaks down the specific dashboard features that directly impact sales and shows exactly how to use them for measurable results.
Understanding the FBA Dashboard Ecosystem
Amazon doesn’t have just one “FBA Dashboard.” The platform offers several interconnected analytics tools that serve different purposes. Understanding which dashboard does what is the first step toward driving sales effectively.
The primary dashboards FBA sellers should monitor include Product Performance Spotlight (PPS), the Returns and Recovery dashboard, Voice of the Customer (VOC), FBA Inventory pages, and Business Reports. Each provides distinct metrics that influence sales from different angles.
Product Performance Spotlight stands out as the central hub for ASIN-level performance. According to the official Amazon Seller Central announcement, PPS consolidates more than 30 metrics into one interface, eliminating the need to jump between separate reports. This centralization saves time and makes pattern recognition significantly easier.
Why Dashboard Analytics Matter for Sales
Data without action means nothing. But the right data interpreted correctly can prevent sales losses before they happen.
According to Amazon Seller Central data, sellers using PPS performance alerts experienced metric recoveries in half the time—just 3 days compared to nearly 6 days for sellers without alerts. Faster problem detection means less revenue loss during the recovery period.
Think about what a three-day difference means when a listing experiences a sudden drop in conversion rate or visibility. Three days of depressed sales on a product moving 50 units daily at $30 profit per unit equals $4,500 in lost profit. Multiply that across multiple ASINs and the impact becomes substantial.
Product Performance Spotlight: The Central Analytics Hub
Product Performance Spotlight serves as the command center for ASIN monitoring. This tool brings together sales data, traffic metrics, inventory status, pricing information, costs, and promotional performance into one consolidated view.
Accessing PPS is straightforward. Navigate to Seller Central, select Reports, then Business Reports, then the By Child ASIN Report. Click into any child ASIN to open the Product Performance Spotlight interface.
Setting Up Proactive Alerts
The alert system represents PPS’s most valuable sales-protection feature. These notifications flag significant performance changes automatically, allowing sellers to respond immediately rather than discovering problems during routine checks days later.
Custom alerts can be configured based on specific needs. Sellers can set thresholds for metrics like conversion rate drops, inventory level changes, pricing fluctuations, or traffic decreases. When a metric crosses the defined threshold, an alert triggers.
Real talk: alerts only help if someone acts on them. Build a process for reviewing and responding to alerts within 24 hours. Assign responsibility if multiple people manage the account.
Monitoring the 30+ ASIN-Level Metrics
PPS tracks dozens of metrics, but not all carry equal weight for driving sales.
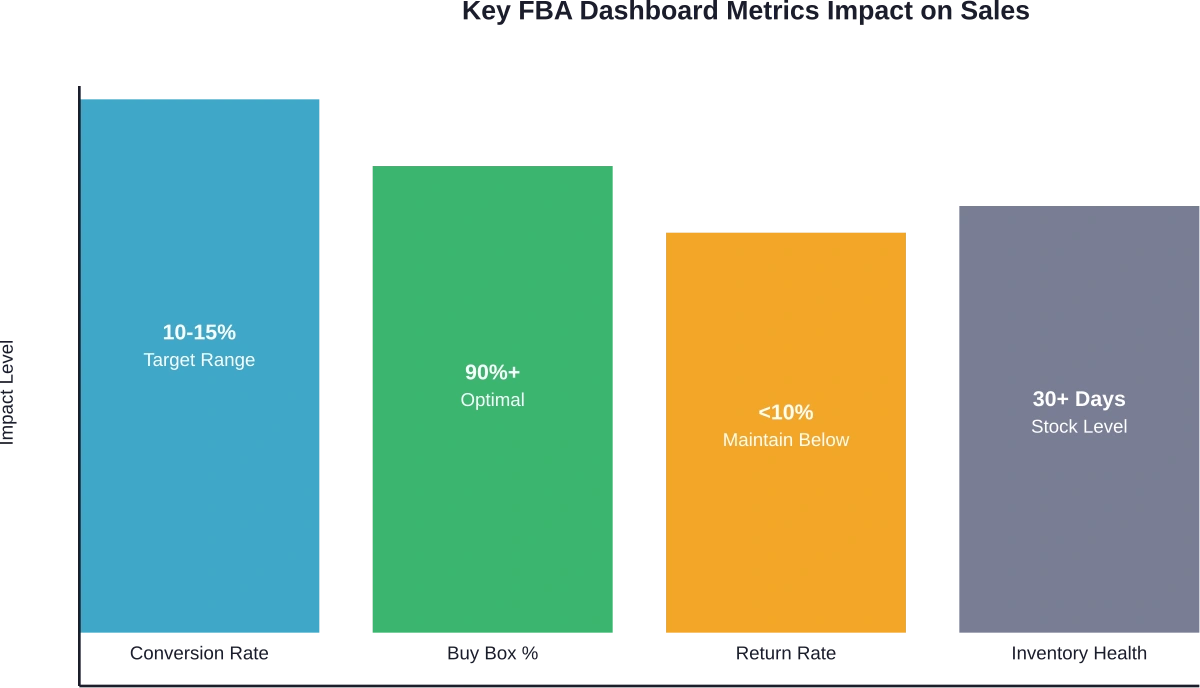
Focus on these high-impact indicators:
- Unit Session Percentage: This conversion rate metric shows how many sessions result in purchases. According to authoritative sources, the average Unit Session Percentage for Amazon is between 10-15%. Numbers below this range typically indicate listing optimization needs.
- Sessions: Total product page views indicate traffic levels. Sudden drops suggest search ranking issues, suppressed Buy Box, or seasonal shifts.
- Buy Box Percentage: Time spent owning the Buy Box directly correlates with sales. Lost Buy Box means lost revenue.
- Inventory Health: Stock levels impact search visibility. Products approaching stockout receive reduced exposure as Amazon protects customer experience.
- Return Rate: High return rates trigger performance flags and reduce profitability. The metric also appears in the Voice of the Customer dashboard.
Tracking trends matters more than single data points. A 20% week-over-week conversion drop deserves immediate investigation. A 2% fluctuation might be normal variance.
Comparing Against Competition
PPS includes competitive benchmarking that shows how ASINs perform versus similar products. This context reveals whether performance issues stem from internal problems or market-wide trends.
If conversion rates drop but competitors show similar declines, the issue might be seasonal demand shifts or category-wide price compression. If only one ASIN underperforms while competitors maintain steady metrics, the problem is specific to that listing.
Use competitive insights to identify improvement opportunities. Products outperforming the category average represent strengths to double down on. Underperformers need immediate optimization attention.
Leveraging Returns and Recovery Dashboard
Amazon introduced the Returns and Recovery: Insights and Opportunities dashboard for all sellers to provide centralized visibility into return patterns and inventory recovery options.
Returns directly impact profitability and sales velocity. High return rates trigger account health concerns and reduce net profit per unit. More importantly, return patterns often signal fixable product or listing issues.
ASIN-Level Return Insights
The dashboard provides detailed return metrics including return rate by ASIN, top return reasons, and trending patterns over time. This granular data helps pinpoint exactly why customers send products back.
Common return reasons include:
- Item not as described (often a listing accuracy problem)
- Defective or doesn’t work properly (quality control issue)
- Bought by mistake (impulse purchase with weak product-market fit)
- Better price available (pricing strategy problem)
- No longer needed (slow shipping or wrong product expectations)
Each return reason suggests a different solution. “Item not as described” returns require listing updates with more accurate images, dimensions, or feature descriptions. “Defective” returns demand supplier conversations or quality checks. “Better price available” returns might indicate pricing is too high relative to perceived value.
Reducing Return Rates to Boost Net Sales
Lower return rates mean more revenue retained. A product with $100,000 in gross sales and a 15% return rate nets $85,000 in retained revenue. Reducing returns to 8% improves retained revenue to $92,000.
Actionable steps to reduce returns:
- Update product images to show accurate colors, sizes, and details
- Enhance product descriptions with precise specifications
- Add comparison charts in A+ Content to set proper expectations
- Include dimensional diagrams or scale references
- Address common questions proactively in bullet points
- Improve packaging to prevent shipping damage
- Conduct quality control audits with suppliers
Monitor return rate changes after implementing corrections. The dashboard’s trend tracking shows whether interventions work.
Recovery Metrics for Grade and Resell
For sellers enrolled in Amazon’s Grade and Resell program, the Returns and Recovery dashboard displays recovery metrics including net recovery value, units sold as graded items, and total sales from recovered inventory.
This feature turns a cost center (returns) into a revenue stream. Products returned in resalable condition get graded and relisted, recovering value that would otherwise be lost.
Voice of the Customer Dashboard for Sales Protection
The Voice of the Customer (VOC) dashboard consolidates customer feedback signals including product reviews, customer questions, return rates, and star ratings.
As announced in 2024, Amazon enhanced VOC with integrated Return Rate and Star Rating features, creating a single location to monitor customer experience indicators that directly impact search ranking and conversion.
Understanding Star Rating Impact
Star ratings appear prominently in search results and on product detail pages. They influence click-through rates from search and conversion rates on the listing itself.
Products with 4.5+ star ratings typically see higher click-through and conversion compared to products below 4 stars. The difference compounds—better ratings lead to more sales, more sales generate more reviews, more reviews strengthen rating stability.
The VOC dashboard displays star ratings as they appear to customers, making it easy to spot ASINs with rating problems. Products below 4 stars need immediate attention through listing improvements, product quality fixes, or proactive customer support.
Acting on Customer Feedback
Customer questions and negative reviews reveal specific concerns preventing purchases or causing dissatisfaction. The VOC dashboard aggregates this feedback for systematic analysis.
Look for patterns in questions. If multiple customers ask about dimensions, the listing doesn’t communicate size clearly. If questions focus on compatibility, add a compatibility chart. Answer questions thoroughly—responses appear publicly and help future customers.
Negative reviews deserve equally careful analysis. Sort by rating to read 1-star and 2-star reviews first. Categorize complaints by theme (quality issues, shipping problems, inaccurate descriptions, missing features). Themes with multiple mentions require corrective action.
Optimizing FBA Inventory Management
Inventory levels directly affect sales potential. Stockouts kill momentum and ranking. Excess inventory ties up capital and incurs storage fees. The FBA Inventory page helps balance these competing concerns.
Monitoring Inventory Performance Index
The Inventory Performance Index (IPI) score reflects overall inventory health. Scores above 450 unlock benefits including unlimited storage and better placement options. Scores below 450 trigger storage limits that constrain growth.
IPI factors include:
- Excess inventory percentage
- FBA sell-through rate
- Stranded inventory percentage
- In-stock inventory rate
Improving IPI requires addressing each component. Reduce excess inventory by running promotions on slow movers. Improve sell-through by optimizing listings and adjusting prices. Fix stranded inventory by resolving listing errors. Maintain in-stock rates through better forecasting.
Using Restock Recommendations
The FBA Inventory page provides restock recommendations based on sales velocity and lead time. These suggestions help prevent stockouts on high-performing ASINs.
But wait. Restock recommendations aren’t perfect. They assume consistent demand and don’t account for seasonality, promotional plans, or market changes. Use recommendations as a starting point, then adjust based on business knowledge.
Track historical days of supply to understand seasonal patterns. Products that sell 10 units daily in December might sell 3 daily in February. Restock quantities should reflect these variations.

Monitor Ad Performance With WisePPC
FBA logistics handle fulfillment, but advertising and product visibility still drive sales. WisePPC helps sellers analyze campaign data and product performance through detailed dashboards. By reviewing keyword results, campaign metrics, and product trends, sellers can see how advertising supports their FBA listings.
Managing FBA Sales and Amazon Ads?
Use WisePPC to:
- track campaign and keyword performance
- review product-level sales metrics
- manage and adjust Amazon PPC campaigns
👉 Explore WisePPC to get clearer visibility into your Amazon advertising data.
Actionable Strategies to Drive Sales
Dashboard data becomes valuable only when translated into action. Here’s how to turn metrics into sales improvements.
Strategy 1: Create a Weekly Dashboard Review Routine
Set a recurring calendar block for dashboard analysis. Consistency matters more than duration—30 minutes weekly beats an occasional 3-hour deep dive.
During each review:
- Check PPS alerts and investigate any flagged ASINs
- Review top 10 products for metric changes (conversion, sessions, Buy Box %)
- Examine VOC dashboard for new negative reviews or rating drops
- Scan Returns dashboard for return rate increases
- Verify inventory levels on best sellers
Document findings and actions in a simple spreadsheet. This creates a performance history that reveals long-term trends.
Strategy 2: Prioritize High-Impact Problems
Not every metric deserves equal attention. Focus on issues with the biggest revenue impact first.
A 5% conversion drop on a product generating $10,000 monthly in sales costs $500 per month. A 10% conversion drop on a $1,000 monthly product costs $100. Fix the $10,000 product first.
Calculate potential revenue impact using this formula: Current Monthly Revenue × Metric Change % = Monthly Impact. Rank problems by monthly impact and work down the list.
| Issue Type | Revenue Impact | Fix Difficulty | Priority Level |
|---|---|---|---|
| Lost Buy Box | High | Medium | Urgent |
| Conversion Rate Drop | High | Medium | High |
| Increased Return Rate | Medium | Medium | High |
| Stock Out Risk | High | Low | High |
| Rating Below 4.0 | High | High | Medium |
| Excess Inventory | Low | Medium | Medium |
| Traffic Decline | Medium | High | Medium |
Strategy 3: Test and Measure Listing Optimizations
Dashboard metrics provide the feedback loop for optimization experiments. Make one change at a time and monitor metrics for 7-14 days to assess impact.
Testing workflow:
- Identify underperforming metric (low conversion, high returns, etc.)
- Hypothesize cause (unclear images, inaccurate description, weak bullet points)
- Make single targeted change (add dimension photo, rewrite bullets, etc.)
- Monitor metric in PPS for 7-14 days
- Evaluate results and iterate
This systematic approach builds knowledge about what actually moves metrics for specific products. Over time, it becomes easier to diagnose and fix problems quickly.
Strategy 4: Leverage Seasonal Insights
Historical data in dashboards reveals seasonal patterns that inform inventory planning and promotional timing.
Compare current year metrics to the same period in previous years. Products showing consistent November-December spikes need inventory buildup by October. Products with summer peaks require different planning.
Seasonal insights also guide when to refresh listings. According to Amazon’s Spring Listing Refresh guidance (published February 2026), optimizing listings before traffic peaks captures more demand during high-volume periods.
Strategy 5: Address Buy Box Loss Immediately
Lost Buy Box typically stems from pricing, inventory, or account health issues. The impact is severe—most customers purchase from whoever holds the Buy Box.
When Buy Box percentage drops in PPS:
- Check pricing against featured offer
- Verify sufficient inventory levels
- Review account health metrics
- Ensure fulfillment speed remains competitive
Pricing adjustments often restore Buy Box within hours. Inventory shipments take longer but remain critical for sustained Buy Box ownership.
Strategy 6: Use Returns Data to Improve Product Quality
Returns dashboard insights extend beyond listings into product development and supplier management. High return rates for specific defects indicate quality control problems worth addressing at the source.
Share return data with suppliers. Products with “defective” returns above 5% need supplier investigation. This collaborative approach improves product quality, reduces future returns, and protects margins.
Some suppliers respond well to data. Others don’t. Persistent quality issues might require finding alternative suppliers.
Advanced Dashboard Tactics
Once basic dashboard monitoring becomes routine, more sophisticated approaches can extract additional value.
Cross-Reference Multiple Dashboards
Insights deepen when connecting data across dashboards. A conversion rate drop in PPS combined with increased negative reviews in VOC suggests a recent product quality change. Traffic decline in PPS alongside lost Buy Box percentage points to pricing or inventory issues.
Look for correlations between seemingly unrelated metrics. Return rate increases that coincide with star rating drops indicate customer dissatisfaction that requires urgent attention. Inventory Performance Index declines alongside slow sell-through rates signal excess inventory problems.
Build Custom Reports for Trend Analysis
Amazon allows exporting data from various dashboard views. Download weekly snapshots of key metrics and compile them in spreadsheets for longer-term trend analysis than dashboards provide by default.
Track metrics like:
- Weekly conversion rates by top ASINs
- Monthly return rates by product category
- Quarterly inventory turnover ratios
- Year-over-year seasonal pattern comparisons
Historical data reveals patterns that inform strategic decisions about product line expansion, seasonal inventory planning, and pricing strategy adjustments.
Set Competitive Benchmarks
Use PPS competitive comparison data to establish internal benchmarks. If top competitors maintain 14% conversion rates while yours sits at 11%, that 3-point gap represents improvement opportunity.
Calculate what closing that gap means financially. A product with 10,000 monthly sessions at 11% conversion makes 1,100 sales. At 14% conversion, the same traffic generates 1,400 sales—a 27% increase in units sold from improved conversion alone.
Common Dashboard Mistakes to Avoid
Even with access to comprehensive analytics, sellers make predictable mistakes that limit results.
Mistake 1: Alert Fatigue
Setting too many alerts creates noise that drowns out meaningful signals. Configure alerts only for metrics that actually warrant immediate action.
High-priority alerts: Buy Box loss, conversion drops exceeding 15%, inventory running below 15 days supply, return rate spikes above 20%.
Low-priority alerts: Minor traffic fluctuations, small session changes, normal seasonal variations.
Mistake 2: Reacting to Short-Term Variance
Metrics fluctuate daily due to random variation. A single day’s conversion rate drop doesn’t necessarily indicate a real problem. Wait for 3-5 days of consistent decline before diagnosing issues and implementing fixes.
Exception: Buy Box loss warrants immediate investigation regardless of duration since it stops sales completely.
Mistake 3: Ignoring Smaller ASINs
It’s natural to focus dashboard monitoring on top sellers. But emerging products and mid-tier ASINs deserve attention too. Small problems caught early prevent them from becoming big problems.
Dedicate at least 20% of dashboard review time to non-top-10 products. Scan for significant metric changes even on lower-volume SKUs.
Mistake 4: Analysis Without Action
Looking at dashboards accomplishes nothing without follow-through. Every review session should end with a prioritized action list and assigned responsibilities.
Document three things after each dashboard review: what changed, why it likely changed, and what action will be taken. Without this discipline, dashboard monitoring becomes busywork.
Integrating Dashboard Insights with Broader Strategy
FBA dashboards shouldn’t exist in isolation. The metrics and insights should inform decisions across all aspects of the business.
Inventory Planning and Forecasting
Historical sales velocity data from dashboards improves inventory forecasting accuracy. Rather than guessing reorder quantities, base decisions on actual sell-through rates adjusted for seasonal patterns.
Use the FBA Inventory page’s historical days of supply metric to calculate appropriate reorder points. Products selling 20 units daily with 30-day lead times need reordering when inventory drops to 600 units (20 × 30 days), plus safety stock.
Product Development Decisions
Return reasons and customer feedback from dashboards reveal product improvement opportunities and new product ideas.
Frequent “too small” return reasons suggest adding a larger size. Common questions about missing features indicate demand for those features. Low star ratings with specific complaint patterns guide product redesign efforts.
Marketing and Advertising Optimization
Dashboard metrics inform advertising strategy. Products with strong organic conversion rates but low traffic are ideal candidates for increased ad spend. Products with high traffic but weak conversion need listing optimization before justifying more advertising investment.
Use conversion rate data to set appropriate Advertising Cost of Sales (ACoS) targets. Products converting at 15% can support higher ad costs than products converting at 8%.
Staying Current with Dashboard Updates
Amazon continuously evolves its seller tools. New dashboard features appear regularly, existing ones get enhanced, and metrics sometimes change.
Product Performance Spotlight launched officially in October 2025. The Returns and Recovery dashboard arrived in November 2025. Voice of the Customer gained Return Rate and Star Rating integration in December 2024. These are recent additions—more changes will come.
Monitor Amazon Seller Central announcements and the “News” section for updates about dashboard enhancements. When new features launch, invest time learning them. Early adopters of new analytics tools gain competitive advantages while others lag behind.
Real-World Application: A Dashboard-Driven Sales Recovery
Theory matters, but practical application demonstrates real value. Consider a seller monitoring a product that suddenly showed declining performance in PPS.
The alert flagged a 20% conversion rate drop over five days. Investigation revealed the cause: a competitor launched with aggressive pricing that captured the Buy Box. The seller’s Buy Box percentage fell from 95% to 30%.
Cross-referencing with the VOC dashboard showed no review or rating changes, confirming the issue wasn’t product quality. The Returns dashboard showed stable return rates, further evidence of pricing rather than product problems.
Action taken: adjusted pricing to regain Buy Box competitiveness while analyzing whether the new price point remained profitable. Buy Box percentage recovered to 85% within 48 hours. Conversion rates normalized within a week.
Total time from alert to resolution: 3 days. Without proactive monitoring, the issue might have persisted for weeks, causing significantly more revenue loss.
Taking Dashboard Insights to the Next Level
Mastering FBA dashboards represents just one component of successful selling. The data provides visibility, but sustained growth requires combining dashboard insights with strong fundamentals across product selection, listing optimization, inventory management, and customer service.
The sellers seeing the best results don’t just check dashboards—they build systematic processes around the data. They create standard operating procedures for responding to specific alert types. They maintain documentation of what optimizations worked. They train team members on dashboard interpretation.
This systematic approach transforms dashboard data from interesting information into competitive advantage. Problems get solved faster. Opportunities get identified earlier. Decisions get made with confidence backed by data rather than guesswork.
Conclusion: Data-Driven Sales Growth
Amazon’s FBA Dashboard ecosystem offers powerful tools that most sellers underutilize. Product Performance Spotlight, Returns and Recovery, Voice of the Customer, and FBA Inventory dashboards provide the visibility needed to drive sales systematically.
The difference between average and exceptional performance often comes down to how quickly problems get identified and resolved. Sellers using proactive alerts and regular dashboard monitoring recover from issues in half the time—3 days versus 6 days according to Amazon’s data. That speed advantage compounds across dozens of ASINs and hundreds of potential issues annually.
Start with the fundamentals: set up Product Performance Spotlight alerts, schedule weekly dashboard reviews, and create a simple process for acting on insights. As comfort with the tools grows, layer in more sophisticated analysis like cross-dashboard correlation and competitive benchmarking.
The dashboards are ready. The data is available. The question is whether sellers will use these tools to their full potential or let valuable insights sit unexamined while competitors pull ahead.
Ready to transform dashboard data into sales results? Start by accessing Product Performance Spotlight in Seller Central today and configuring alerts for the top 10 ASINs. That single action will begin building the data-driven approach that separates growing businesses from stagnant ones.
Frequently Asked Questions
How often should FBA sellers check dashboard metrics?
Top-performing sellers typically check critical metrics daily and conduct comprehensive dashboard reviews weekly. Daily checks focus on alerts and key indicators like Buy Box percentage and inventory levels. Weekly reviews involve deeper analysis of trends, return patterns, and customer feedback. Monthly reviews should include competitive benchmarking and strategic assessment of overall account performance.
Which dashboard metric has the biggest impact on sales?
Conversion rate (Unit Session Percentage) typically impacts sales most directly since it determines how efficiently traffic converts to revenue. Buy Box percentage runs a close second—losing the Buy Box can reduce sales by 70-90% overnight. Both metrics deserve primary focus during dashboard monitoring since improvements yield immediate results.
Can dashboard data help prevent account suspensions?
Absolutely. The Voice of the Customer dashboard and Account Health metrics provide early warning signs of performance problems that could lead to suspension. Monitoring return rates, negative feedback, and order defect rates allows sellers to address issues proactively before they reach suspension thresholds. Quick response to dashboard alerts helps maintain account health.
What’s the difference between Product Performance Spotlight and Business Reports?
Product Performance Spotlight consolidates ASIN-level data from multiple sources into a single interface with proactive alerts and competitive benchmarking. Business Reports provide broader historical data across the entire catalog. PPS focuses on real-time monitoring and problem detection for individual ASINs, while Business Reports serve historical analysis and trend identification across products.
How do returns shown in the Returns dashboard affect sales?
High return rates impact sales through multiple mechanisms. They reduce net revenue directly, trigger potential account health issues, signal quality problems that may lead to negative reviews, and increase operational costs. More importantly, products with consistently high return rates may receive reduced search visibility as Amazon protects customer experience. Monitoring and reducing return rates protects both current and future sales.
Should sellers using FBA also monitor Multi-Channel Fulfillment analytics?
Sellers using Amazon’s fulfillment network for non-Amazon orders should definitely monitor the Multi-Channel Fulfillment Analytics dashboard. It provides insights into fulfillment costs, delivery performance, and order volumes from other channels. This data helps optimize multi-channel strategy and ensures FBA remains cost-effective for off-Amazon sales.
What actions have the fastest impact on sales after dashboard analysis?
Regaining lost Buy Box, restocking products approaching stockout, and fixing stranded inventory typically produce the fastest sales impact—often within hours or days. Pricing adjustments and resolving inventory issues take immediate effect. Listing optimizations based on return data or customer feedback require longer (7-14 days) to show measurable improvement as the changes accumulate traffic and conversion data.
Join the WisePPC Beta and Get Exclusive Access Benefits
WisePPC is now in beta — and we’re inviting a limited number of early users to join. As a beta tester, you'll get free access, lifetime perks, and a chance to help shape the product — from an Amazon Ads Verified Partner you can trust.
 No credit card required
Free in beta and free extra month free after release
25% off for life — limited beta offer
Access metrics Amazon Ads won’t show you
Be part of shaping the product with your feedback
No credit card required
Free in beta and free extra month free after release
25% off for life — limited beta offer
Access metrics Amazon Ads won’t show you
Be part of shaping the product with your feedback
